Configuring and Displaying the Deal Management Dashboard
|
Page Name |
Definition Name |
Usage |
|---|---|---|
|
TR_DASH_03_CFG |
Configure the Deal Management dashboard to display these charts:
|
|
|
TR_DASH_03_CFG2 |
Select a time series to apply to the Fixed vs. Floating Rate Investments and Fixed vs. Floating Rate Debt charts. |
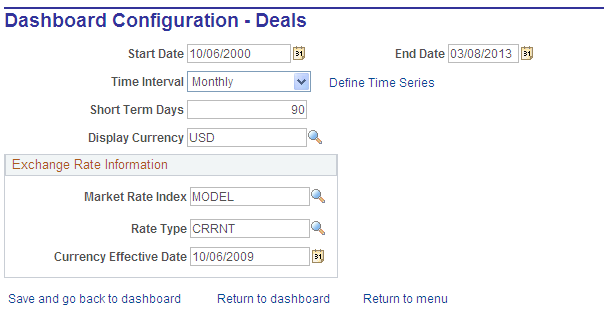
Use the Dashboard Configuration - Deals page (TR_DASH_03_CFG) to configure to display the investment mix, debt mix, fixed versus floating rate investments, fixed versus floating rate debt, and open foreign exchange contracts dashboards.
Navigation:
Treasury Dashboards
Click the Deals link, or after displaying the charts, click the Update Configuration link on the Treasury Dashboards page.
This example illustrates the fields and controls on the Dashboard Configuration - Deals page.
Field or Control |
Description |
|---|---|
Start Date and End Date |
Select a start and end date to apply to the data that appears on the Fixed Rate vs. Floating Rate chart. |
Time Interval |
Select the appropriate time interval for which you want the chart to see data. |
Define Time Series |
Define monthly, quarterly, half-yearly or yearly time intervals based on business calendars. |
Important! Open Foreign Exchange Contracts do not use time intervals.
Investment Mix Chart
Use the Investment Mix chart to view short-term and long-term investments.
Click on a chart point to access detail information. The information appears in a grid in a new window.
Debt Mix Chart
Use the Debt Mix page (TR_DASH_DEAL) to display the investment mix deals detail and summary data.
Click on a chart point to access detail information. The information appears in a grid in a new window.
Fixed vs. Floating Rate Investments Chart
Use the Fixed vs. Floating Rate Investments chart to view fixed versus floating rate investments.
This chart displays the fixed rate versus the floating rate investment amounts within a selected time series.
Click on a chart point to access detail information. The information appears in a grid in a new window.
Fixed vs. Floating Rate Debt Chart
Use the Fixed vs. Floating Rate Debt chart to view fixed versus floating rate debts.
This chart compares the total amount of debt accumulated based on a fixed interest rate versus a floating interest rate within a selected time series.
Click on a chart point to access detail information. The information appears in a grid in a new window.
Open Foreign Exchange Contracts Chart
Use the Open Foreign Exchange Contracts page to view open FX contracts.
This chart displays the amount of open foreign currency exchange contract bought or sold by an organization on a given date.
Click on a chart point to access detail information. The information appears in a grid in a new window.
Use the Dashboard Configuration - Time Series page (TR_DASH_03_CFG2) to select a time series to apply to the Fixed vs. Floating Rate Investments and Fixed vs. Floating Rate Debt dashboards.
Navigation:
Click the Define Time Series link on the Dashboard Configuration - Deals page.