Performing a Failure Analysis
This section discusses how to search for failure event data to analyze, specify a failure analysis method, review the Totals grid data, and create an analysis chart.
|
Page Name |
Definition Name |
Usage |
|---|---|---|
|
WM_FAIL_ANLYS_INQ |
Search for failure event data to analyze. |
|
|
Failure Analysis – Save/Restore Criteria Page |
WM_FLEXSRCH_MAINT |
Save the search criteria entered on the Failure Analysis page or select a previously saved version of the search criteria. |
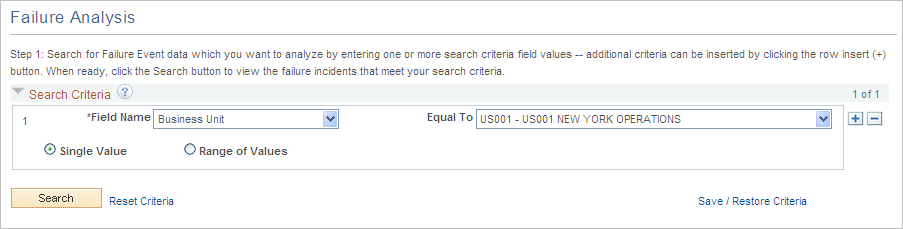
Use the Failure Analysis page (WM_FAIL_ANLYS_INQ) to search for failure event data to analyze.
Navigation:
Maintenance Management, Inquiries and Reports, Failure Analysis, Failure Analysis page.
This example illustrates the fields and controls on the Feature Analysis page - Search Criteria. You can find definitions for the fields and controls later on this page.
Field or Control |
Description |
|---|---|
Field Name |
Click the downward arrow and select a field name from the list of field names related to the failure events that you want to use in your analysis. Fields in the drop down list with an asterisk (*) indicate the possibility of a one or one to many matches, while fields without an asterisk indicate a one to one match. For example, if you select Failure Impact* as the Field Name value and you indicate that it is Equal To a specific value, the system will search for any failure events that have at least that specific failure impact value. However, there may be other impact values that could also be associated with a particular failure event. |
Equal To |
Based on the field name you selected, select a specific value for this field. Depending on the value that you select for the Field Name, the Single field or Range of fields will appear in a drop down list, a prompt, a date prompt, or with no controls. |
Single Value |
Select this option if you select a value in the Equal To field and you want the search to include that one selected value. You can also select this option if you select a blank value for the Equal To field and you want the search to include all values for the field name. For example, if you select Business Unit for the Field Name value and leave the Equal To field value blank, then the system will search for failure events associated with all business units. |
Range of Values |
Select this option if you selected a value for the Equal To field and want the system to search for failure events located within a specific range of values. You can specify only the From Value and leave the To Value blank and the system will search for values greater than or equal (>=) to the From Value. When you specify the To Value and leave the From value blank and the system will search for values equal to or less than (=<) the To Value. For example, if you select Business Unit as the Field Name value, and you select BU0001 as the Equal To value, when you click this Range of Values button, the Equal To field name changes to a From Value and a To Value field. If you already selected BU0001 as the From Value, you can select from the list of business units, such as BU0001, BU0002, BU0003, BU0004, BU0005, and BU0006, and select BU0004 for the To Value field. This indicates that the system will include from BU0001 to BU0004 in the search for associated failure event data when you click the Search button. You can also leave the To Value blank and the system will search for all business units greater than or equal to the From Value. Note: When you select a Field Name such as Asset ID as your search criteria, you must select an Asset BU before you can select a specific value for the asset ID. You can add more than one row and select different search criteria to narrow your search for failure events. |
Search |
Click this button to search for failure events based on the selected search criteria. |
Reset Criteria |
Click this link to reset the search criteria to its default setting. |
Save/Restore Criteria |
Click this link to display the Failure Analysis – Save/Restore Criteria page. Note: If the search criteria includes more than one row, the system includes all the rows when you restore the specified search criteria. |
Saving and Restoring Search Criteria
You can save current search criteria or restore a saved search by selecting the appropriate option on this page. If you restore a saved search, the search criteria will include all rows included in the search criteria.
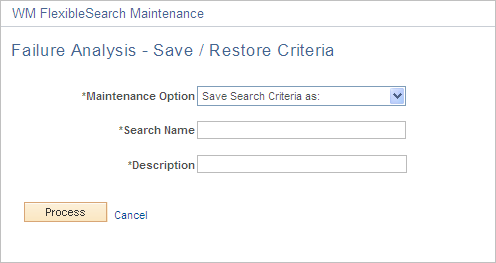
Use the Failure Analysis – Save/Restore Criteria page (WM_FLEXSRCH_MAINT) to save the search criteria entered on the Failure Analysis page or select a previously saved version of the search criteria.
Navigation:
Click the Save/Restore link on the Failure Analysis page.
This example illustrates the fields and controls on the Failure Analysis - Save/Restore Criteria page (1 of 2). You can find definitions for the fields and controls later on this page.
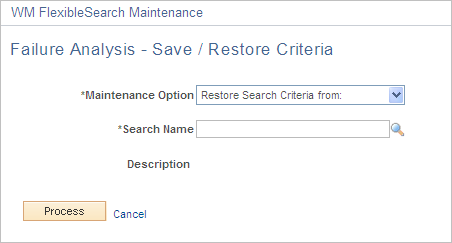
This example illustrates the fields and controls on the Failure Analysis - Save/Restore Criteria page (2 of 2). You can find definitions for the fields and controls later on this page.
Field or Control |
Description |
|---|---|
Maintenance Option |
Select one of these options:
|
Cancel |
Click to return to the Failure Analysis page. |
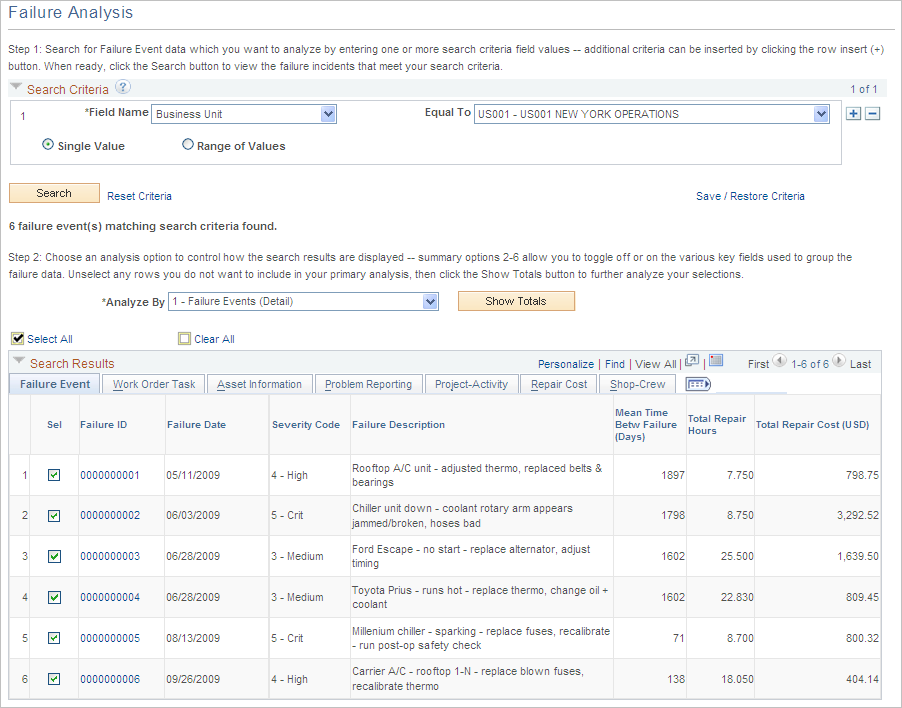
After you click the Search button, the system displays the search results. You can select all or some of the search results to include in your analysis. This type of analysis is good for ad hoc queries. You can conduct a failure analysis for many different combinations of detail and summary data.
Navigation:
Click the Search button on the Failure Analysis page
This example illustrates the fields and controls on the Failure Analysis page. You can find definitions for the fields and controls later on this page.
Field or Control |
Description |
|---|---|
Analyze By |
Click the downward arrow and select one of these values:
|
Summarize By |
The buttons that appear in this group box enable you to control the columns that appear in the Search Results grid so that you can group the summary data in different ways for your analysis. This group box appears or does not appear depending on value that you selected in the Analyze By field. If the value you selected in the Analyze By field is:
If you select a green button and the button changes to a red x, then that value's column does not appear in the selected search results. In other words, you can toggle a particular key field on or off to include or exclude that field in the summarized results. For example, if you select the green button next to Asset Identification, a red x replaces the green button, then the Asset Identification column does not appear in the selected search results. If you select the red x next to Asset Identification and the red x is replaced with a green button, then the Asset Identification column reappears in the selected search results. In addition, if you select the green button for AM Business Unit and the green button for Asset Location, these buttons are each replaced by a red x, and the AM Business Unit and Asset Location columns do not appear in the selected search results.
|
Show Totals/Hide Totals |
Once you have selected the type of analysis you want to conduct, as well as determined the summary columns (if applicable), select the Show Totals button to display a grid of failure data totals based on your selected search results. When you select the Show Totals button, the button name changes to Hide Totals. When you click the Hide Totals button, the grid of failure data totals is hidden and the Show Totals button replaces the Hide Totals button. |
The totals grid data is calculated based on your selection in the Analyze By field, selection of the Summarize By buttons (if applicable), and the number of selected rows
Navigation:
Click the Show Totals button to display the totals grid on the Failure Analysis page.
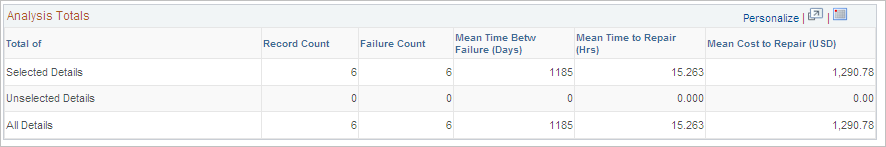
This example illustrates the fields and controls on the Analysis Totals grid - Failure Analysis page. You can find definitions for the fields and controls later on this page.
Field or Control |
Description |
|---|---|
Totals Of |
This column contains these row:
|
Record Count |
Displays the number of records included for each row value. |
Failure Count |
Displays the total number of failures events based on the row and the selected failure data rows. |
Mean Time Betw Failure (Days) (mean time between failure) |
Displays the mean number of days between failures for the Selected Details, the Deselected Details, and All Details. This metric is based calculating the individual days between a failure, which subtracts the start date of a subsequent failure event from the start date of a prior failure event. These individual days between a failure event are summed and divided by the total number of failure events. |
Mean Time to Repair (Hrs) (hours) |
Displays the mean number of hours that it takes to repair the failure. This metric is based on the number of hours entered in the Time to Repair field on the Work Order Failure Tracking page. A Mean Meter Units Betw Failure column will appear to the right of Mean Time to Repair, if you specified a single meter type as part of the search criteria. The column label will display Meter Type, Meter Units Betw Failure, and Meter UOM. |
Mean Cost to Repair |
This amount is calculated based on the Cost to Repair value entered on the Work Order Failure Tracking page for the Selected Details, the Deselected Details, and All Details. |
Navigation:
Click the Analysis Chart group box on the Failure Analysis page. (Scroll to the Analysis Chart group box on the Failure Analysis page.)
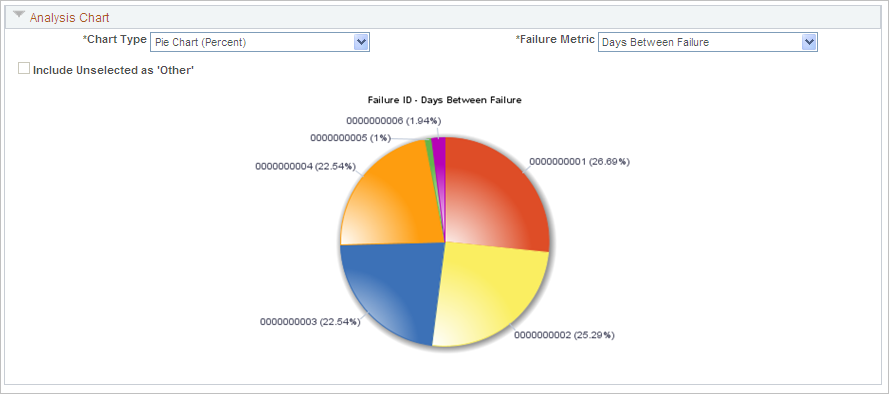
This example illustrates the fields and controls on the Analysis Chart group box - Failure Analysis page. You can find definitions for the fields and controls later on this page.
Field or Control |
Description |
|---|---|
Chart Type |
Select one of these types of charts:
|
Failure Metric |
Select the type of failure metric that you want to appear on the selected chart:
|
Include Unselected as 'Other' |
Select this check box to include the deselected data values in the chart. Selecting this option displays the deselected results data as a single pie slice or bar labelled as OTHER. |