Performing an Asset Maintenance Cost Analysis
This section presents an overview of the Asset Maintenance Cost Inquiry and discusses how to set up for asset maintenance cost analysis reporting, run the Maintenance Cost Data Extraction Process (WM_ASSETCOST), select assets for maintenance cost analysis, review maintenance costs by specified dimensions, chart maintenance costs by specified dimension or period, review maintenance costs by asset, chart maintenance cost data by asset or period, and review asset maintenance costs by work order.
|
Page Name |
Definition Name |
Usage |
|---|---|---|
|
WM_REPORTING_SETUP |
Specify the monthly, quarterly, and yearly summary calendars, which the system uses when it runs the Maintenance Cost Data Extraction Process (WM_ASSETCOST) and enables you to view the Asset Maintenance Cost Inquiry |
|
|
WM_COST_RUN_OPT |
Extracts and summarizes all of the asset cost history data to use to perform an online asset cost maintenance analysis for work order and non-work order related assets the first time it is run. Subsequent runs should extract only new cost history or recently updated cost history. |
|
|
Asset Selection |
WM_ASSET_COST_SRCH |
Search for assets to analyze using the Asset Maintenance Cost Inquiry. |
|
Asset Search |
WM_ASSET_SRCH_SEC |
Identify the assets that you want to include in an asset cost group. |
|
WM_COST_ANALYSIS |
Search for the assets that you want to display and analyze on this page based on one or more specific dimensions. |
|
|
Statistics |
ASSET_MAINT_02 |
Enter estimated and actual costs for a selected asset. |
|
Asset Cost by Meter Type |
WM_COST_BY_MTRTYPE |
Review the total actual cost, total usage, and cost per unit of usage for each meter type associated with an asset. |
|
Maintenance Cost by Asset |
WM_COST_BY_ASSET |
Review the work order and non-work order related maintenance costs for a specific asset. |
|
Asset Information |
WM_WO_ASSET_SEC |
Review information associated with a selected asset. |
|
Asset Cost by Component |
WM_COST_BY_COMP |
Review the component's description and costs associated with a selected asset. |
|
Asset Cost by Maintenance Type |
WM_COST_BY_MAINT |
Review costs by maintenance type associated with the selected asset. |
|
Maintenance Cost by Work Order |
WM_COST_BY_WO3 |
Review any work order costs associated with the selected asset. |
Use the Asset Maintenance Cost Inquiry in PeopleSoft Maintenance Management to analyze work order and non-work order related asset maintenance costs for assets based on a specified time frame. The work order costs are based on work orders that are closed in PeopleSoft Maintenance Management and updated in the Asset Maintenance History. The non-work order costs are entered manually in the Track Service and Repairs component in PeopleSoft Asset Management. Both work order and non-work order costs are derived from the Asset Maintenance History in PeopleSoft Asset Management and comprise the overall costs in the Asset Maintenance Cost Inquiry.
You can specify an asset dimension and time frame and view the total summary maintenance costs and detail maintenance costs for the specified dimension such as asset type and subtype for an asset group or for all assets. You can also drill down from the Cost Analysis page for a selected asset cost dimension to view the individual asset costs within that dimension on the Cost by Asset page. In addition, you can drill down from the Cost by Asset page for a selected asset to view all the work order and non-work order data associated with the selected asset on the Cost by WO (work order) page.
If you only want to view the costs by asset, you can select the Cost By Asset tab, enter the appropriate search criteria and view the asset costs. If you only want to view the costs by work order, you can select the Cost By WO tab, enter the appropriate search criteria and view any work orders or non-work orders associated with one or more assets.
The Asset Maintenance Cost Analysis divides the cost per unit of usage, such as run time hours or miles driven into the maintenance cost per vehicle. This metric enables you to compare which assets are costing more or less than others to maintain. The maintenance planner can examine other factors, such as the manufacturer, the location, the region in which the asset is operated, the skill level of the maintenance technicians repairing the vehicles, the way the vehicles are operated, and more to determine various methods for lowering the cost of maintenance.
The Asset Maintenance Cost Inquiry enables you to:
Create one or more asset cost groups and analyze the maintenance costs for assets in a specific group.
Perform an asset search based on selected asset criteria.
View a maintenance cost summary and detail costs of all of the assets within a specified dimensions.
Analyze asset maintenance costs based on a various dimensions.
Analyze asset maintenance cost per unit of usage.
View the asset maintenance cost per unit of usage by meter type.
View the asset maintenance cost for a selected asset.
View the asset maintenance cost by maintenance type.
View asset maintenance cost by work order.
View the maintenance costs associated with child (component) assets for a selected parent asset and given time frame.
This is the component cost roll-up to the parent asset based on maintenance history and asset hierarchy structure history.
Reporting Setup
Before you can run the Maintenance Cost Data Extraction process (WM_ASSETCOST) and view the Asset Maintenance Cost Inquiry, you must set up monthly, quarterly, and yearly summary calendars and specify these calendars on the Maintenance Management Reporting Setup component. The Maintenance Cost Data Extraction process uses this information to extract asset maintenance cost data for the Asset Maintenance Cost Inquiry. You do not change this calendar setup once you run the extraction process and summarize the data. If you change the reporting calendar, you must run the cost extraction process again to refresh all cost data.
Maintenance Cost Data Extraction Process
You run the Maintenance Cost Data Extraction process (WM_ASSETCOST) based on how you set up the summary calendars in the Reporting Setup component. The first time that you run the Maintenance Cost Data Extraction process, it should extract and summarize all of the asset cost history data to use to perform an online asset maintenance cost analysis for work order and non-work order related assets. Ideally, any subsequent run should extract only new cost history or recently updated cost history.
The system can easily detect all newly added cost history, but cannot detect recently updated cost history. The Track Service and Repairs component in PeopleSoft Asset Management enables you to add new costs associated with an asset, as well as update work order maintenance costs that are generated by the WO Close process (WM_CLOSE). To accommodate this restriction, when you run the Maintenance Cost Data Extraction process, you can specify the number of months of data to refresh in the subsequent run while keeping all older data in tact on the Maintenance Cost Data Extraction Process run control page. This helps to maximize the processing performance. You can also refresh all cost data, which refreshes all previously extracted cost data as if you are running the process for the first time.
When you run the process, you can select a check box to:
Refresh the Date Sequence table by specifying the number of years into the past for the process to generate the date and populate the date sequence.
Refresh all previously flattened asset hierarchy data.
If this data is not refreshed, the system processes the asset hierarchy that was changed since the previous run.
Refresh all previously extracted maintenance cost data.
If you choose not to extract all of this data, you can enter the number of months of cost history data for the process to refresh.
Note: You should set this process to run in the background on a regular basis on the Process Scheduler Request page.
When the extraction process runs, it extracts the asset maintenance costs for both work order and non-work order maintenance for all assets including the costs associated with the components of the assets. The process:
Calls the Generate Date Dimension process based on the request parameter.
Calls the Flatten Asset Hierarchy Process (WM_ASSETHIER).
Extracts the asset cost information (work order, non-work order, and asset component costs) from the transaction tables.
The Asset Maintenance History records provide the costs, which are populated either by the Work Order Close process in PeopleSoft Maintenance Management or by manual user data entry on the Track Service and Repairs component in PeopleSoft Asset Management.
How to Determine the Cost Per Unit of Usage
Cost per unit of usage is determined based on the total maintenance cost (both work order and non-work order costs) and total usage (both work order and non-work order usage) captured during the analysis period.
Work Order Related Cost
If the cost is related to the work order, the system uses the work order task close date to determine whether to include these costs in the cost analysis. For example, if a work order task is closed on 02/02/2005 and the analysis time frame is Q2 2005 then the system will include the work order task cost.
Non-Work Order Related Cost
If the cost is non-work order related (entered manually by the user in the PeopleSoft Asset Management Track Service and Repairs component), the system uses the maintenance date associated with the cost entry in the Asset Maintenance Cost History table to determine whether to include this cost in the cost analysis.
This table describes how the unit costs are calculated. The work order related costs are based on the close date of the work order and the non-work order related costs are based on the maintenance date in the Track Service and Repairs component in PeopleSoft Asset Management.
|
1/1/2006 |
2/15/2006 |
6/20/2006 |
7/1/2006 |
12/12/2006 |
12/31/2006 |
2/15/2007 |
|
|---|---|---|---|---|---|---|---|
|
Miles Usage |
100 |
300 |
400 |
500 |
150 |
||
|
Cost (USD) |
1,000.00 |
2,000.00 |
1,000.00 |
||||
|
WO Related |
WO Related |
Non-WO Related |
Non-WO Related |
WO Related |
|||
|
Analysis Period |
Total Usage |
Total Cost |
Unit Cost |
||||
|
2006 – Q1 |
100 |
1,000.00 |
10.00 |
||||
|
2006 – Q2 |
300 |
||||||
|
2006 – Q3 |
400 |
2,000.00 |
5.00 |
||||
|
2006 – Q4 |
500 |
||||||
|
2006 |
1300 |
3,000.00 |
2.31 |
||||
|
2007 |
150 |
1,000.00 |
6.67 |
Cost Analysis Charts
Based on the data you choose to analyze, you can create charts to view these costs in a graphic format. These charts include:
Cost by Analysis Dimension chart
This charts the asset maintenance costs for a specified number of specific categories that fall under the asset dimension that you select to display in the Asset Cost by Dimension grid. For example, if the dimension is asset type and subtype, you might want to display the maintenance costs of the asset types facility, hardware, and software on chart.
Total Cost by Period chart
This charts the asset maintenance costs for each period for a specified number of periods. This data is based on the specified dimension data and the periods that appear in the Asset Cost by Dimension grid.
Estimated, Total, or Unit Cost by Asset chart.
This charts either the estimated, total, or unit cost for a selected number of assets from the Asset Cost grid.
Estimated, Total Cost, or Unit Cost by Period chart.
This charts the estimated, total, or unit cost for a selected number of periods for assets that appear in the Asset Cost grid.
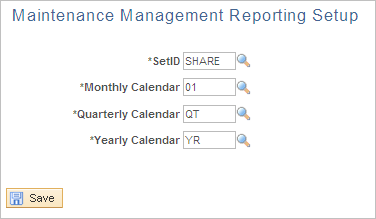
Use the Maintenance Management Reporting Setup page (WM_REPORTING_SETUP) to specify the monthly, quarterly, and yearly summary calendars, which the system uses when it runs the Maintenance Cost Data Extraction Process.
Navigation:
This example illustrates the fields and controls on the Maintenance Management Reporting Setup page. You can find definitions for the fields and controls later on this page.
Note: Fiscal calendars are set up in the sample data and are usually set up when you set up all of your financial data.
Field or Control |
Description |
|---|---|
SetID |
Enter the SetID associated with the cost analysis data that you want to analyze. |
Monthly Calendar |
Select the monthly fiscal calendar to apply when running the Maintenance Cost Data Extraction process. |
Quarterly Calendar |
Select the quarterly fiscal calendar to apply when running the Maintenance Cost Data Extraction process. |
Yearly Calendar |
Select the yearly fiscal calendar to apply when running the Maintenance Cost Data Extraction process. |
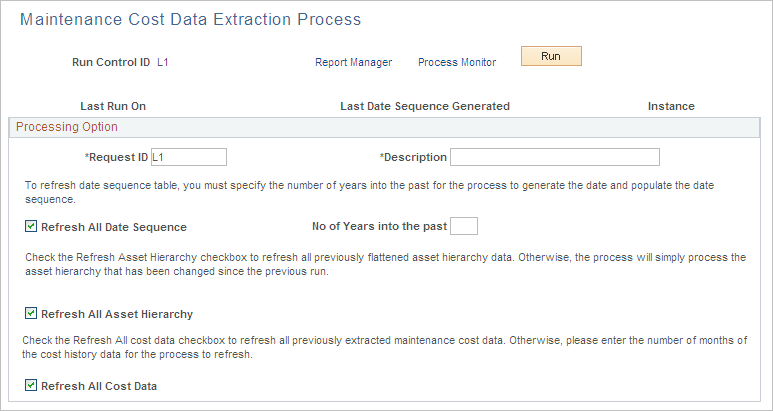
Use the Maintenance Cost Data Extraction Process page (WM_COST_RUN_OPT) to extracts and summarizes all of the asset cost history data to use to perform an online asset cost maintenance analysis for work order and non-work order related assets the first time it is run.
Subsequent runs should extract only new cost history or recently updated cost history.
Navigation:
Maintenance Management, Work Order Management, Work Order Processing, Maintenance Cost Extraction
This example illustrates the fields and controls on the Maintenance Cost Data Extraction Process page. You can find definitions for the fields and controls later on this page.
Field or Control |
Description |
|---|---|
Last Run On |
Displays the date and time that this process was last run. If this is the first run of this process, this field is blank. |
Last Date Sequence Generated |
Displays the date of the last date sequence that the system processed. |
Instance |
Displays a process instance number after you run this process. If a second process instance number appears to the right of the Last Date Sequence Generated field, this is the process instance generated for the run prior to this current process run. In other words, this process instance number appears if the process has been run before. You can click the Process Monitor link to view the status of the process on the Process Server tab. You can also review the Server List and click the Details list to review the various details regarding each process instance. |
Request ID |
Enter this ID on the Extract Maintenance Cost - Add a New Value when you add a run control ID. You can change this ID on the Maintenance Cost Data Extraction page. |
Description |
Enter the description of the Request ID. |
Refresh All Date Sequence |
Select this check box to refresh the date sequence table. |
No of years into the past (number of years into the past) |
Enter the number of past years that you want to include in the date sequence refresh process. |
Refresh All Asset Hierarchy |
Select this check box to refresh all previously flattened asset hierarchy data. Otherwise, the system processes only the asset hierarchies that were changed since the previous run. |
Refresh All Cost Data |
Select this check box to refresh all previously extracted maintenance cost data, or leave this check box blank to display the No of Months of Cost Data check box. |
No of Months of Cost Data (number of months of cost data) |
Enter the number of months of cost that you want to refresh. |
Run |
Click this button to run the Maintenance Cost Data Extraction process (WM_ASSETCOST). |
Navigation:
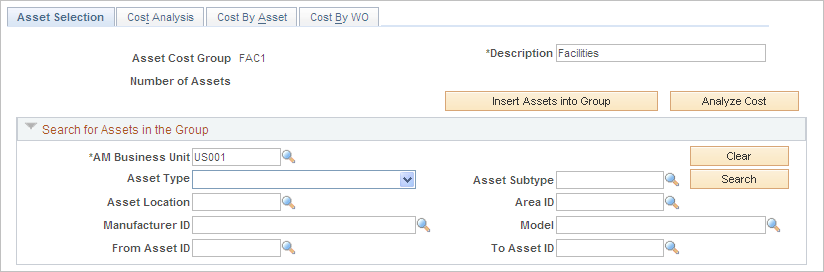
This example illustrates the fields and controls on the Asset Maintenance Cost Inquiry - Asset Selection page (1 of 2). You can find definitions for the fields and controls later on this page.
This example illustrates the fields and controls on the Asset Maintenance Cost Inquiry - Asset Selection page (2 of 2). You can find definitions for the fields and controls later on this page.
To create an Asset Cost Group on the Asset Maintenance Cost Inquiry - Add a New Value tab by entering a name for the Asset Cost Group and clicking the Add button.
Field or Control |
Description |
|---|---|
Asset Cost Group |
The name of the Asset Cost Group that you created on the Add a New Value page appears in this field. |
Description |
Enter a description of this Asset Cost Group. |
Number of Assets |
This is the total number of assets in the group and is updated when you search for and select the assets that you want to include in this group, click the Insert Assets into Group button, and save the page. |
Insert Assets into Group |
Click this button to search for and select the assets that you want to include in this group. The Asset Search page appears where you can select asset search criteria to narrow your search and click the Search button. A list of assets appear in the Search Results grid. You can also select the assets that you want to include in the asset cost group and click the Copy Selected Assets button. Note: If an asset is associated with an asset component hierarchy, the Hierarchy icon displays in the Search results for the asset. You can click this icon to access the Asset Component Hierarchy page and view the asset hierarchy structure. Note: You can add only three hundred assets to a group at a time due to the page restrictions. |
Search for Assets in the Group |
Use this group box when you access an existing asset cost group and want to search for specific assets within this group. Select the asset criteria to narrow your search and click the Search button inside the group box. Only the assets within this asset cost group that meet your search criteria appear on the Assets Selected for Analysis grid. |
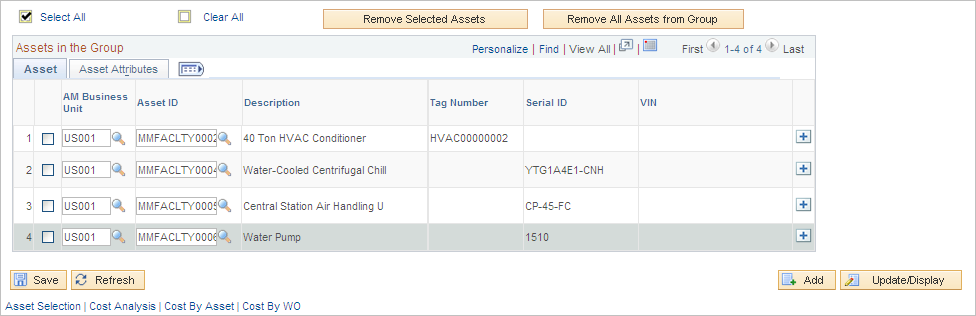
Assets in the Group |
Select the assets that you want to analyze in this grid before you click the Analyze Assets button. |
Remove Selected Assets |
Select the assets that you want to remove from the asset cost group from the Assets Selected for Analysis grid and click this button to remove those assets. |
Remove All Assets from Group |
Click this button to remove all of the assets in this asset cost group. A page appears asking if you are sure you want to remove all the assets in the group. If you select Yes, all of the assets in this asset cost group are removed. |
Analyze Assets |
Click this button to display the Maintenance Cost Analysis tab in order to perform the maintenance cost analysis. |
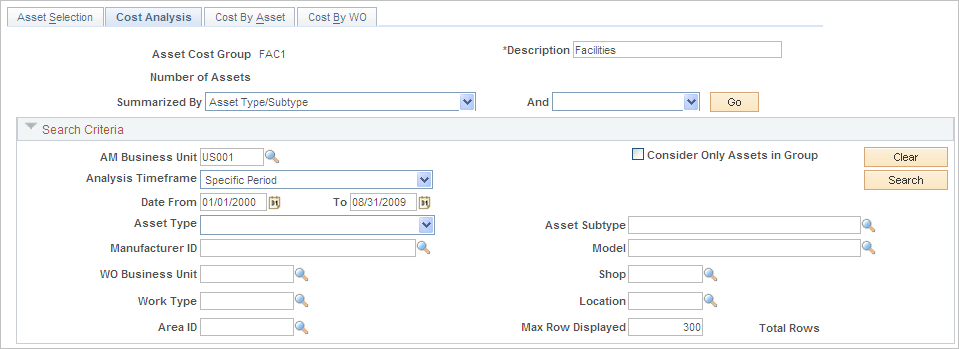
Use the Cost Analysis page (WM_COST_ANALYSIS) to search for the assets that you want to display and analyze on this page based on one or more specific dimensions.
Navigation:
Maintenance Management, Inquiries and Reports, Asset Maintenance Cost Inquiry, select the Cost Analysis tab.
This example illustrates the fields and controls on the Asset Cost Analysis Inquiry - Cost Analysis page (1 of 4). You can find definitions for the fields and controls later on this page.
This example illustrates the fields and controls on the Asset Cost Analysis Inquiry - Cost Summary grid - Cost Analysis page (2 of 4). You can find definitions for the fields and controls later on this page.
This example illustrates the fields and controls on the Asset Cost Analysis Inquiry - Cost Detail grid - Cost Analysis page (3 of 4). You can find definitions for the fields and controls later on this page.
This example illustrates the fields and controls on the Asset Cost Analysis Inquiry - Currency grid - Cost Analysis page (4 of 4). You can find definitions for the fields and controls later on this page.
Field or Control |
Description |
|---|---|
Summarized By |
Click the down arrow to display and select one of these options:
|
And |
Click the down arrow to display and select one of these options:
|
Go |
Click this button after selecting the previous two dimension values. Any asset maintenance costs that fall under the selected criteria appear on the tabs in the Asset Cost by Specified Dimension group box. Note: Use the Search Criteria group box described below to narrow your search criteria to expand the number of assets or just assets in the selected group before you select this button. |
Search Criteria
Use this Search Criteria group box to narrow your search for all assets or just assets within this group to display in the Asset Cost by Specified Dimension group box.
Field or Control |
Description |
|---|---|
Consider Only Assets in Group |
Select this check box to only include assets in the specified group in the search. Remove the check mark to include all assets included in the search criteria. |
Analysis Timeframe |
Select one of these time frame options:
|
Max Rows Displayed (maximum rows displayed) |
Enter the maximum number of rows that you want to display in the Asset Cost by Specified Dimension group box. You can enter any number you want. Refer to the example in the description of the Total Rows field. |
Total Rows |
Displays the total number of rows that meet the search criteria. If you choose to display a subset of the total row, you specify a number in the Max Rows Displayed field. For example, if 2000 rows are returned from the search, and you entered 200 in the Max Rows Displayed field, then the Total Rows field value will be 2000, but the number of rows that display on the page will be 200. You can enter any value you want for the Max Rows Displayed field. Note: This field and the one above it also appear on the Maintenance Cost By Asset and Maintenance Cost By Work Order pages. |
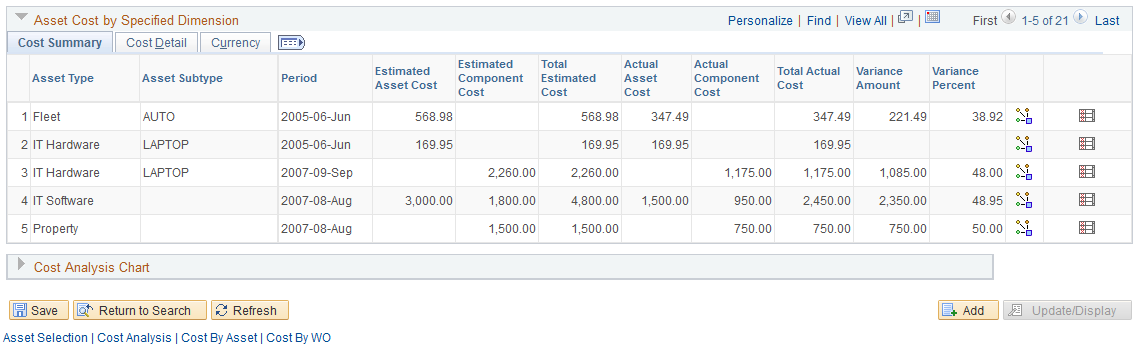
Asset Cost by Specified Dimension
Asset costs display in the grid fields of these tabs.
Field or Control |
Description |
|---|---|
Cost Summary |
Click this tab to display a summary of the asset maintenance costs for assets associated with work orders and assets entered manually in PeopleSoft Asset Management. The grid fields are based on the dimensions that you specified at the top of the page. The system obtains the estimated costs from the Asset Maintenance History records. The Work Order Close (WM_CLOSE) process, which processes the scheduled costs, and manual entries in the PeopleSoft Asset Management Track Service and Repairs component update these Asset Maintenance History records. The system displays the following summarized information:
|
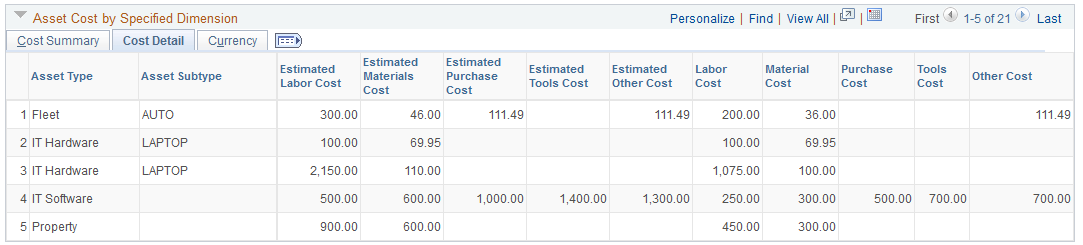
Cost Detail |
Select this tab to view a summary of the detail values based on the selected dimension and period. The fields on this tab are:
|
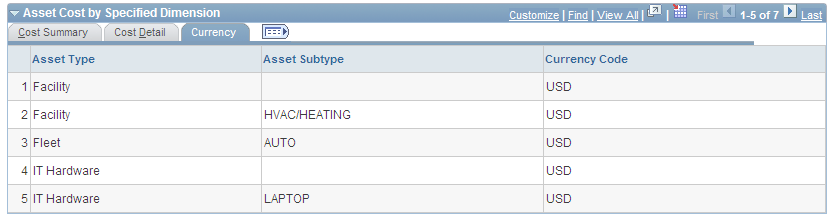
Currency |
Select this tab to view the currency associated with these summarized asset maintenance costs. This is the base currency derived from the Asset Management business unit and the default book, such as CORP, associated with Asset Management business unit. |
Navigation:
Click the Cost Analysis Chart group box (click the down arrow) to select options that result in the display of various charts of the summary asset maintenance cost data.
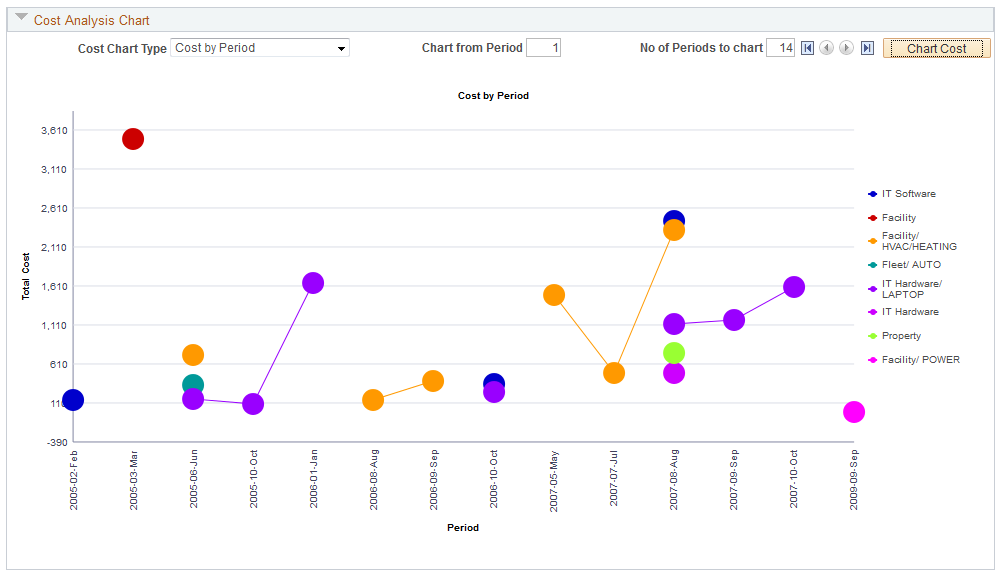
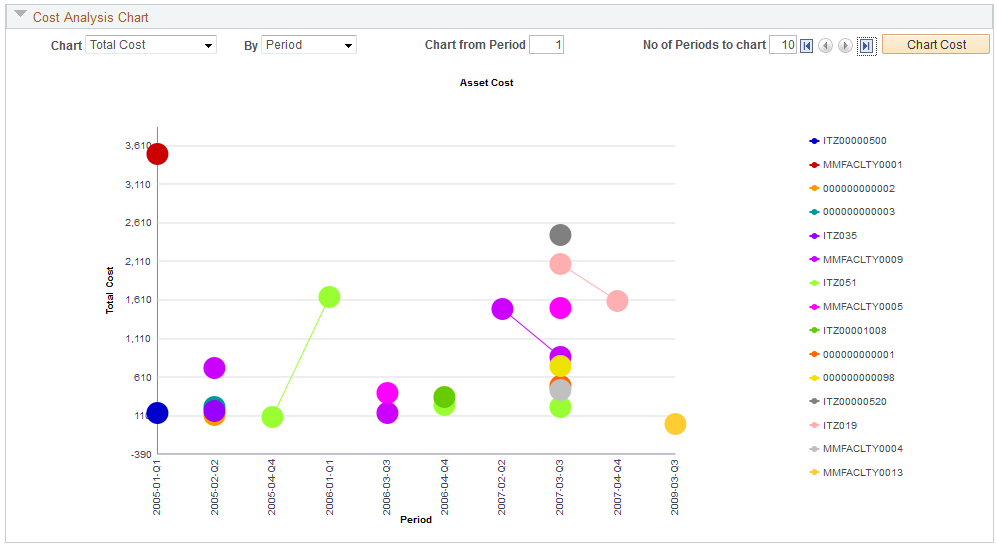
This example illustrates the fields and controls on the Cost Analysis Chart by Period. You can find definitions for the fields and controls later on this page.
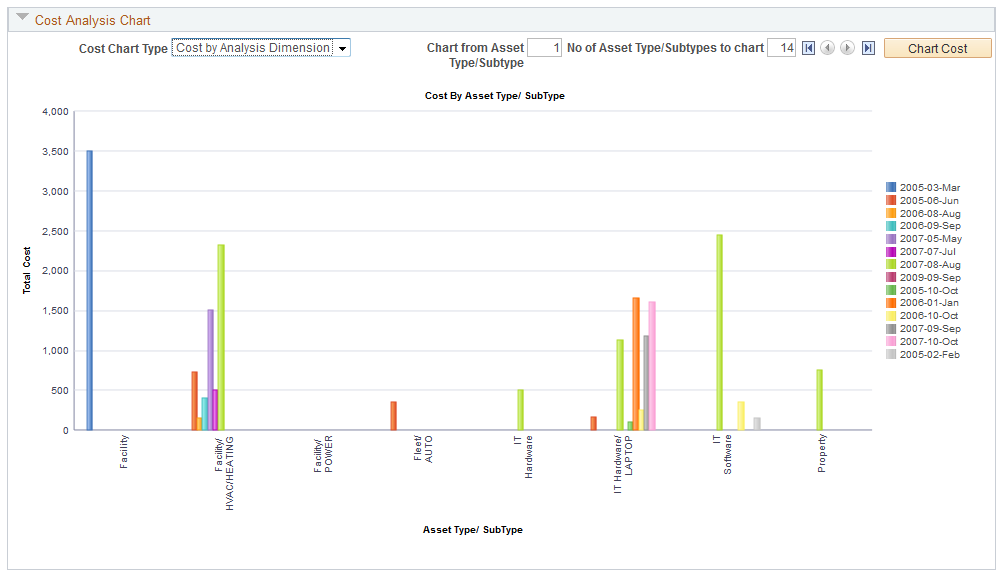
This example illustrates the fields and controls on the Cost Analysis Chart by Dimension. You can find definitions for the fields and controls later on this page.
Field or Control |
Description |
|---|---|
Cost Chart Type |
Click the down arrow to identify if you want to create a Cost Analysis by Dimension chart or a Cost by Period chart. Select:
Important! Use the scroll arrows to the left of the Chart Cost button to view any additional Cost Dimensions or Periods depending on the selected chart type. For example, if you indicated that you wanted to chart the total costs of twelve asset type/subtypes, and only four asset types/subtypes appear on the first page of the chart, click the arrow to scroll through the remaining pages of the chart to view the total costs for the remaining eight asset type/subtypes. |
Charting Cost by Period
Field or Control |
Description |
|---|---|
Cost by Period |
Select this option to create a chart based on the values selected for Summarize By fields and the Analysis Timeframe field. For example if you chose Asset Type/Subtype, Fiscal Quarter, and specified a period from 01/01/2008 to 12/31/2009 clicked the Chart Cost button, After you select the Cost by Period option, the Chart From Period and No of Periods to Chart fields appear on the chart. Do not enter any values in these two fields the first time you create a chart. Click the Chart Cost button. This will chart all data in the Asset Cost by Specific Dimension grid. The No of Periods to chart field will be updated with the total number of distinct periods in the grid. The system displays the total costs per period for total number of periods included in the Asset Cost by Dimension data for each asset dimension. Each dimension is identified by a different color. For example, you select:
|
Chart From Period |
Enter the number of the period from which you want to start charting. Based on our example, if you enter 1, the first period on the X axis of the chart will be Q1, 2000 for each of the asset type/subtypes. |
No of Periods to Chart (number of periods to chart) |
Enter the total number of periods that you want to appear on the X axis of the chart for each of the asset type/subtypes. Based on our example, if you enter 12, the periods that display on the X axis of the chart will be:
This chart will display the total cost per period for the previous listed 12 periods, with each of the 12 dimensions represented by a different colored line. |
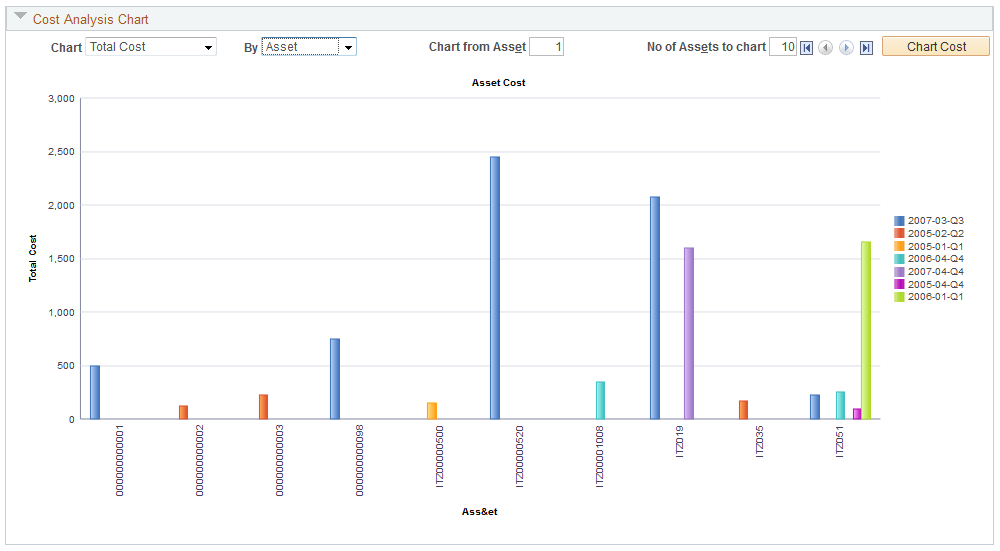
Charting Cost Analysis by Dimension
Field or Control |
Description |
|---|---|
Cost Analysis by Dimension |
Select this value from the Chart Type dropdown list. When you select this option, the system will create a chart based on the data that appears on the Asset Cost by Specified Dimension grids after running the Asset Maintenance Cost process for one of the following dimensions: Asset Type/Subtype Manufacturer/Model Location Area ID Shop WO Type After you select Cost Analysis by Dimension, the fields Chart From (cost dimension such as Asset Type/Subtype) and No of (cost dimension such as Asset Type/Subtypes appear. The first time you create the chart, leave these fields blank and click the Chart Cost button. Assume that you selected Asset Type/Subtypes as the cost dimension for the analysis. When you click the Chart Cost button, the system charts the Total Costs on the Y axis for each asset type/subtype on the X axis that were included in the data after you ran the Asset Cost Analysis process. For example, after clicking the Chart Cost button for the asset type/subtype dimension, the chart displays the following asset type/subtypes on the X axis of the chart. Facility Facility/HVAC Heating Fleet/Auto Fleet/Truck IT Hardware IT Hardware/ Laptop IT Software Property Property/Building Equipment Equipment/Network Machinery The amount of data in a chart containing a large number of asset type/subtypes may difficult to read. To narrow the number of asset type/subtypes that you want to appear on the chart and make it easier to read, you now enter numbers in the additional fields that appear on the chart. |
Chart From (Cost Dimension) |
Enter the number of the cost dimension from which to start charting. The field name that displays is based on the cost dimension value that was selected for the analysis. For our example, the field name appears as Chart From Asset Type/Subtype Enter the number of asset type/subtypes you want to chart from based on the total number that appeared on the first chart you created. In the example twelve asset types/subtypes appeared on the first chart that was run. Now it is required to start the next chart from IT Hardware, which is the fifth asset type/subtype in the X axis of the original chart. Therefore, enter 5 in the Chart From Asset Type/Subtype field. Note: The cost dimension (e.g. Asset Type/Subtype, Location, etc.) will be in alphabetical order on the X-Axis of the chart. This field indicates the Nth cost dimension from which the chart will start. |
No of (Cost Dimensions) (number of cost dimensions) |
Continuing with our example, this field name appears as No of Type/Subtypes. Enter the number of asset type/subtypes that you want to view on the X axis of your chart based on the number you entered in the Chart From Asset Type/Subtype field. Based on the example, assume that it is necessary to chart the total costs for the asset type/subtypes: IT Hardware, IT Hardware/Laptop, IT Software. Since 5 was entered in the previous field to start counting from, enter 3 in this field. Click the Chart Cost button again, the chart displays the total costs for IT Hardware as the first value on the X axis, then the total costs for IT Hardware/Laptop as the next value on the X axis, and the total costs for IT Software as the final value on the X axis. Important! If your data includes a large number of cost dimensions (for example, 30 asset type/subtypes), you can click the arrows to the left of the Chart Cost button to view all of the charted data. |
Chart Cost |
Click the Chart Cost button to display the chart based on the selected and entered criteria such as chart type, chart from period/dimension and more. Important! Use the scroll arrows to the left of the Chart Cost button to view any additional Cost Dimensions or Periods depending on the selected chart type. For example, if you indicated that you wanted to chart the total costs of twelve asset type/subtypes, and only four asset types/subtypes appear on the first page of the chart, click the arrow to scroll through the remaining pages of the chart to view the total costs for the remaining eight asset type/subtypes. |
Navigation:
, select the Cost by Asset tab; or drill down by clicking the View Cost by Asset icon for a selected dimension on the Cost Analysis tab.
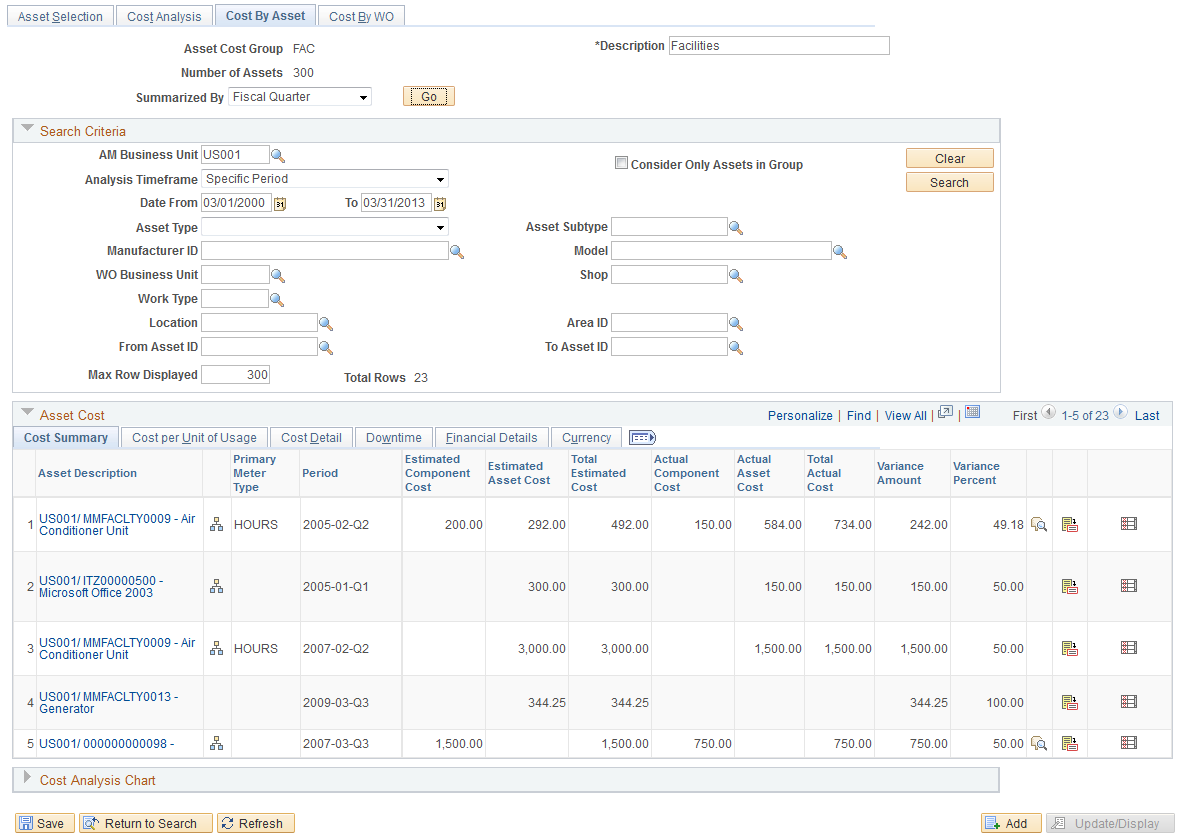
This example illustrates the fields and controls on the Select Cost by Asset tab to display Cost By Asset page. You can find definitions for the fields and controls later on this page.
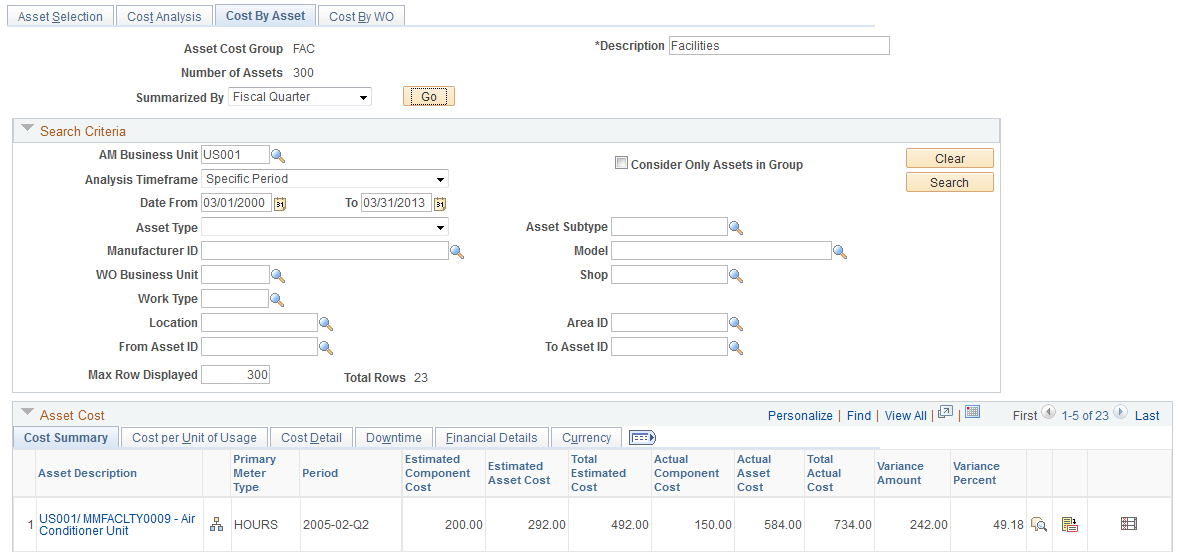
This example illustrates the fields and controls on the Select Asset Cost by Specified Dimension Row to access the Cost By Asset page. You can find definitions for the fields and controls later on this page.
Selecting the Cost By Asset Tab
When you select the Cost by Asset tab to access the Cost By Asset page, you can search for an view the costs of multiple assets either within the asset cost group, specify a subset of assets within the asset cost group, or include assets outside the group. Selecting this tab enables you manipulate the search criteria according to your specifications. or for all assets in the system. Setting up a subset of assets enables you can to perform a more detailed side-by-side analysis using the subsequent data and charting capabilities.
Selecting the View Costs by Asset Icon for a Row on the Cost Analysis Page
Field or Control |
Description |
|---|---|
|
Click the View Cost by Asset icon for a row in the Asset Cost by Specified Dimension grid on the Cost by Analysis tab. The asset cost data for the selected row appears on the Cost by Asset page as display-only. You can not modify this information. When you click the View Cost By Asset icon for a specific row in the Asset Cost by Dimension grid on the Cost Analysis page, the Cost By Asset page displays assets in the Asset Cost grid based on the criteria that you originally specified for that row on the Cost Analysis page. You cannot modify the search criteria on the Cost By Asset page. The only assets that appear in the Asset Cost grid are the assets that fall within the dimensions that you specified on the Cost Analysis search page. This presents a much narrower range of assets to analyze and chart. For example, if you analyze the cost by asset type and subtype and select a row where the asset type and subtype is Fleet/AUTO and the period is April, 2003-04, when you click the Maintenance Cost by Asset icon to drill down to the asset level view, only assets and cost data belonging to the Fleet/AUTO asset type and subtype and fall within the cost for period April, 2003-04 appear on the Maintenance Cost by Asset page. |

Reviewing the Cost by Asset Page
Whether you access the Cost By Asset page by selecting the Cost By Asset tab or clicking the View Cost by Asset icon, an Asset Cost grid appears on the page with these tabs.
Field or Control |
Description |
|---|---|
Cost Summary |
This tab displays the summarized estimated, total estimated, actual, total actual costs, along with the variance for each asset that displays in the grid. If you selected the Cost By Asset tab, these costs will be summarized based on the specification you selected on this page. If you selected the View Cost by Asset icon, these costs will be summarized based on the dimensions that you specified on the Cost Analysis page. In addition, you can:
|
Cost by Unit of Usage tab |
Click this tab to display the cost by unit of usage if the asset is associated with a meter. If the asset is associated with an meter, you can click the Unit Cost by Meter Type icon to display the Asset Cost by Meter Type page. The Asset Cost by Meter Type page lists each type of meter associated with the specified asset based on the selected criteria and the total actual cost, total usage, unit of usage, and the cost per unit of usage for each meter. |
Cost Detail tab |
Click this tab to display the estimated and actual labor, materials, purchases, tools, and other costs associated with this asset. |
Downtime tab |
Click this tab to display the estimated and actual downtime entered for this asset based on the specified time frame. |
Financial Details tab |
Click this tab to display the replacement costs, net book value and insured value of each asset. |
Currency tab |
Click this tab to display the currency code that applies to each asset. |
Use the Maintenance Cost by Asset page (WM_COST_BY_ASSET) to review the work order and non-work order related maintenance costs for a specific asset.
Navigation:
On the Cost By Asset page (tab), click the Cost Analysis Chart arrow.
Navigation:
Maintenance Management, Inquiries and Reports, Asset Maintenance Cost Inquiry, select the Maintenance Cost by Asset tab.
Click the Maintenance Cost by Asset icon for a selected row on the Maintenance Cost Analysis page for an asset.
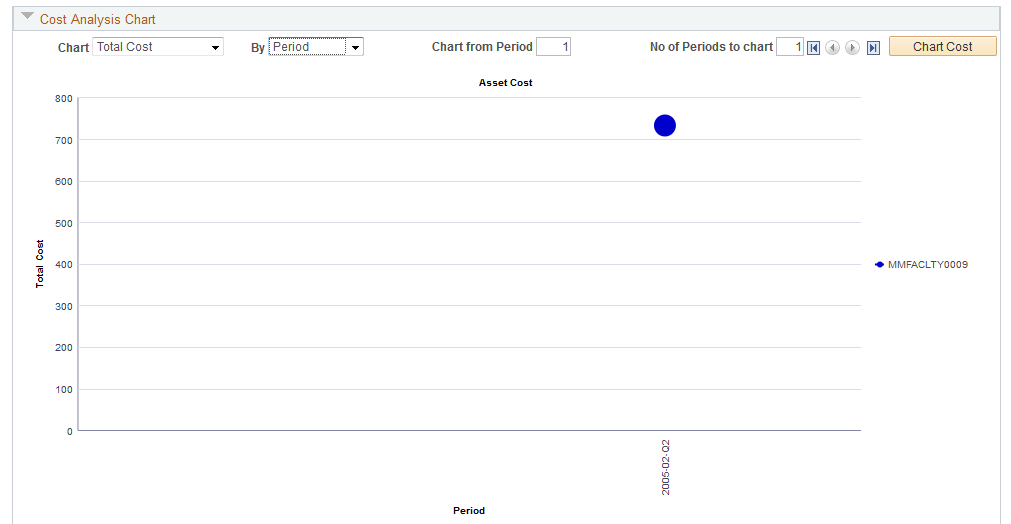
This example illustrates the fields and controls on the Cost Analysis Chart - Total Cost by Period chart based on selection of the Cost by Asset tab. You can find definitions for the fields and controls later on this page.
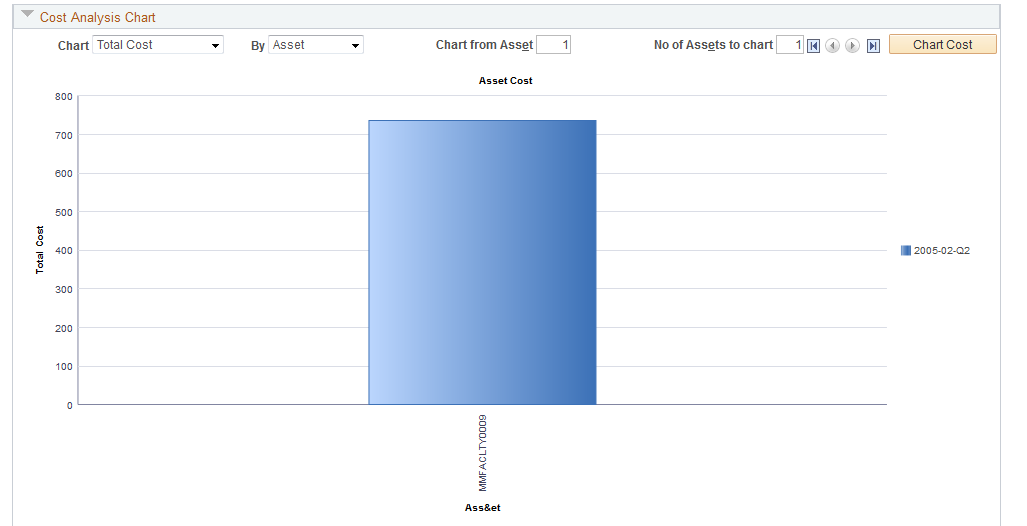
This example illustrates the fields and controls on the Cost Analysis Chart - Total Cost by Asset chart based on selection of the Cost By Asset Tab. You can find definitions for the fields and controls later on this page.
This example illustrates the fields and controls on the Cost Analysis Chart - Total Cost by Period chart based on selection of View Cost by Asset icon. You can find definitions for the fields and controls later on this page.
This example illustrates the fields and controls on the Cost Analysis Chart - Total Cost by Asset chart based on selection of View Cost by Asset icon. You can find definitions for the fields and controls later on this page.
Field or Control |
Description |
|---|---|
Chart |
These field determine the Y axis of the chart. Select one of these values:
|
By |
These fields determine the X axis of the chart. Select one of these values.
|
Charting Estimated, Total, or Unit Costs by Asset
If you selected estimated, total, or unit cost and asset as the values to chart by, you should click the Chart Cost button to display the costs for all of the assets listed in the Asset Cost grids. This helps you determine the value that you want to enter in these fields:
Field or Control |
Description |
|---|---|
Chart from Asset |
Enter the number of the asset from which you want to start charting the data. For example, if ten assets appeared in the first chart that you ran and you wanted to view the chart starting with the 3rd asset, you enter a 3 in this field. The chart will display with the third asset appearing on the X axis in the first position. |
No of Assets to chart |
Enter the number of assets to chart. For example, if ten assets appeared in the first chart that you ran and you only want to view 5 of them on the chart, then you enter 5 in this field. The chart will display five assets starting with the asset number you indicated in the Chart from Asset field. Based on our example, the chart will display the estimated, total, or unit costs (depending on your selection) for assets 3, 4, 5, 6, and 7. |
Chart Cost |
Click this button to display the charted asset cost data. |
Charting Estimated, Total, or Unit Cost by Period
If you selected estimated, total, or unit cost and period as the values to chart by, you should click the Chart Cost button to display the costs for all periods listed for the assets in the Asset Cost grids. This helps you determine the value that you want to enter in these fields:
Field or Control |
Description |
|---|---|
Chart from Period |
Enter the period number from which you want to start charting the data. For example, if you select Fiscal Year for the Summarized By field, Specified for the Timeframe Analysis field, 01/01/2000 for the Date From: field and 01/01/2008 for the To: field, when you run the Asset Maintenance Cost Analysis process (select the Go button), the system will display asset cost data for eight fiscal years for each asset in the Asset Cost grids.
If you enter 4 as the period to chart from, the 4th year (2003 — 2004) will appear as the first period on the X axis of the chart. |
No of Periods to chart (number of periods chart) |
Enter the number of periods to chart. This value will depend on the timeframe that you chose on the Maintenance Cost Analysis page. Continuing with our example, if the data that appeared in Asset Cost grids was eight fiscal years, when you enter 4 into this field and click the Chart Cost button, the chart will display the fiscal years 2003, 2004, 2005, 2006, and 2007 on the X axis of the chart. The Y axis of the chart will be the Estimated Cost, Total Cost, or Unit Cost depending on the value you selected in the Chart: field. Each asset's line is color coded on the chart. |
Chart Cost |
Click this button to display the charted asset cost data. |
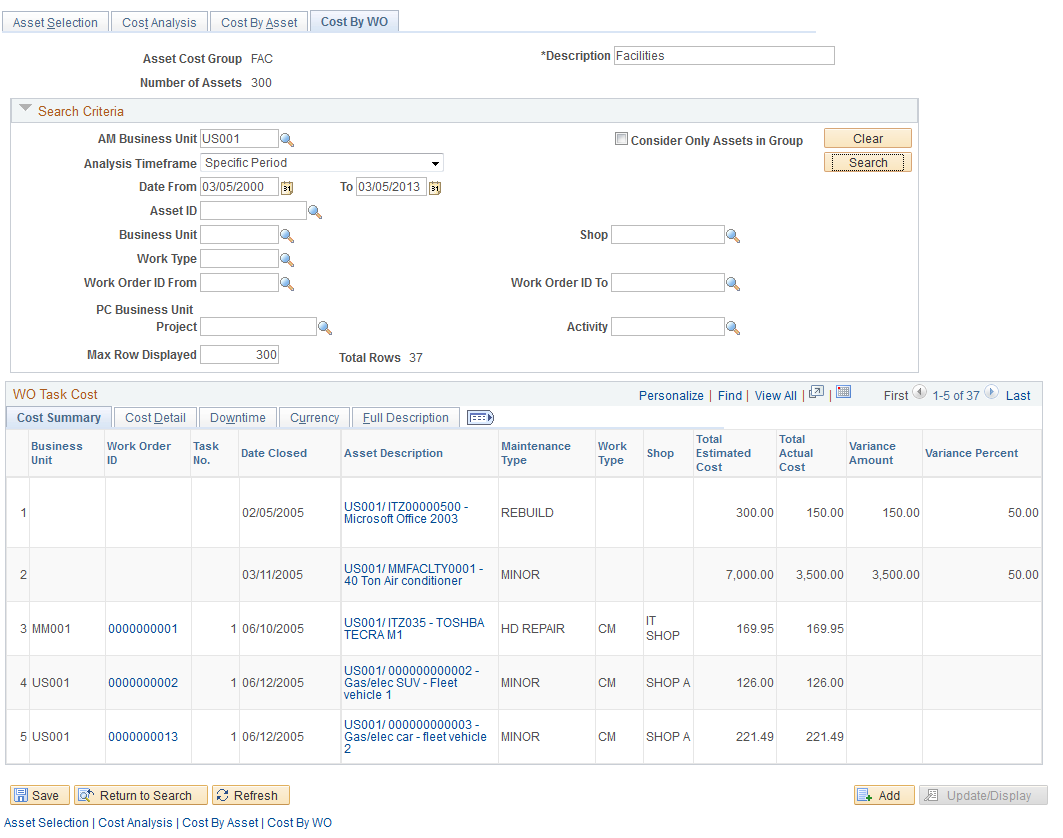
Use the Maintenance Cost by Work Order page (WM_COST_BY_WO3) to review any work order costs associated with the selected asset.
Navigation:
Maintenance Management, Inquiries and Reports, Asset Maintenance Cost Inquiry, select the Maintenance Cost by Work Order tab.
Click the View Cost by Work Order icon for a selected asset row.
This example illustrates the fields and controls on the Cost By Work Order page - tab selection. You can find definitions for the fields and controls later on this page.
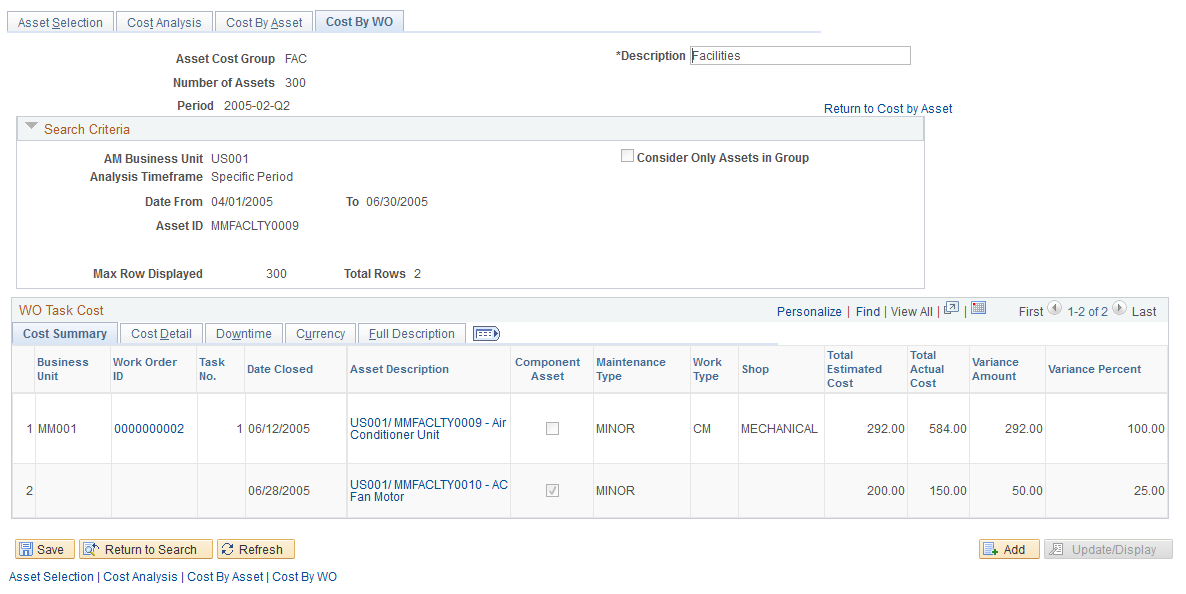
This example illustrates the fields and controls on the Cost By Work Order page - View Cost by Work Order icon selection. You can find definitions for the fields and controls later on this page.
You can view work order and work order task information associated with one or more assets, depending how you access the page.
Selecting the Cost by Work Order Tab
Select the Maintenance Costs by Work Order tab to access the page. There may be times that you are only interested in viewing the work order costs associated with all assets within the specified group or based on all assets in the system based on specific search criteria. You indicate whether you want to consider assets in the group or all assets and enter the appropriate search criteria to display all work orders and non-workorder associated with assets that fall within your search criteria. The costs are derived from the asset maintenance history records, which are populated by either the Work Order Close process or by users, who enter the data manually in the Track Service and Repairs component in PeopleSoft Asset Management.
Clicking the View Cost by Work Order Icon to Access the Cost by Work Order Page
Field or Control |
Description |
|---|---|
|
Click this View Cost by Work Order icon in an asset's row on the Cost by Asset, Asset Cost, Cost Summary tab to display the Cost by WO (work order) page. When you access this page using the icon, the Search Criteria group box information is display-only. This information displays the specified dimensions and information that you selected on the Cost Analysis page. |
 View Cost by Work Order
Field or Control |
Description |
|---|---|
WO Task Cost |
This group box displays a list of the work order and non-work order costs associated with a selected asset. It contains these tabs:
|
Reviewing the Work Order Task Cost Grid
Field or Control |
Description |
|---|---|
WO Task Cost |
This group box displays a list of the work order and non-work order costs associated with a selected asset. It contains these tabs:
|