PeopleSoft Quality Features
This topic provides an overview of Quality features and discusses how to:
Reduce quality costs.
Meet quality requirements.
Create a continuous-improvement environment.
Simplify data collection.
Control and analyze online data.
Maximize system flexibility.
Use interactive analysis tools.
Today, quality professionals deal with competitive pressures to reduce costs, implement international standards, continuously improve processes, and satisfy customers. Quality helps you effectively collect and interpret quality information, helping you reduce scrap, rework, and repairs. Using Quality, you can maintain control of processes, automate labor-intensive tasks, improve communication within the supply chain, and accelerate ISO 9000 family certification.
The application combines online SPC data collection with a relational database for quality analysis. Statistical Quality Control tools help you access and analyze critical quality characteristics. The tools provide an intuitive environment to create what-if scenarios without altering the original data.
Billions of dollars a year are wasted due to poor quality. In less demanding organizations, the cost can be five percent of sales, while others incur up to forty percent of sales. Most costs can be attributed to excess variation in processes and products. But there is also a cost associated with reducing variation. These costs are distributed among four major categories:
Detection
Internal failure
External failure
Prevention
In general, these are the costs associated with producing, identifying, avoiding, or repairing products that don't meet requirements.
While Cost Management can help you capture and analyze the cost of quality, Quality can help you avoid these costs. Quality enables you to reduce process and product variation with advanced control charting methods, Pareto analysis, distribution assessment, and process capability evaluations.
The ISO 9000 global standard has created an enormous need to organize, structure, control, and communicate all facets of the quality system. Quality, combined with Manufacturing, Inventory, and Purchasing, facilitates the organization and maintenance of the quality information system (its structure, control plans, and key documentation) throughout the enterprise. Online access and review of these details improves communication, reduces procedural errors, and contributes to a successful audit of overall quality effort.
When integrating inspection procedures, operation instructions, and other controlled documents, Quality provides an environment for manufacturing consistency and continuous improvement by:
Documenting statistically significant changes in the manufacturing process.
Automatically assessing control violations with immediate notification to operators.
Electronically distributing violations internally or to the extended enterprise (suppliers or customers) using intelligent Workflow agents.
When an out-of-control condition is determined, Quality provides the tools to view the condition, indicate probable causes, and take corrective actions. This information is then tied to the event and, specifically, to the point on the control chart. Additionally, each point (subgroup) on the control chart contains a complete history of traceability data, such as supplier ID or serial ID.
When you receive items on a purchase order or a Return Material Authorization (RMA), Quality provides integration with Purchasing and Inventory to assist in monitoring and inspecting the quality of the item being received or returned.
Throughout the environment, you use advanced security and audit tools to restrict user access and maintain database integrity. In addition to the network, database, and PeopleTools online security, Quality provides audit-trail information for critical areas of the quality management process, including control-plan modifications, data-entry events, control-test violations, specification limit changes, and control limit changes.
This diagram illustrates how the functions and features within Quality (characterize, stabilize, maintain, and improve) help you meet the requirements within a continuous improvement model:
This diagram illustrates how the functions and features within Quality.
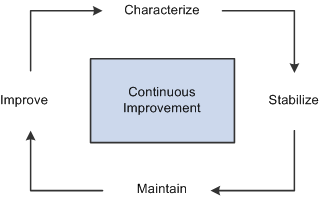
This model incorporates four main continuous activities. Each activity validates the previous activity.
Characterize
The starting point. In this phase, Quality provides tools for an initial set of data to determine what the process or product looks like, statistically and graphically. At this stage, you determine important characteristics, the distribution shape, the measurement system capability, the initial process capability indices, the starting process yield, and Pareto analysis of defects. In addition, you can design the control chart to determine the correct subgrouping, sample frequency, control test sensitivity, and chart type. Ultimately, you'll use Quality to establish a baseline and optimum method of control.
Stabilize
Once the baseline is established, you'll use Quality to help stabilize the process. A process is any set of conditions or system of causes that produce a given result, such as a manufactured product. You must control these conditions to minimize the variation within a process. With Quality, you can monitor this variation by using control charts, analyzing the data for significant changes, and taking immediate corrective action.
Maintain
When a process is first analyzed, it's usually out of control. You can initially monitor and control the process offline, while reducing any negative impact to the operation. After gaining stability, you use online activities to identify and contain less frequent out-of-control occurrences.
To maintain stabilized processes, you monitor for special causes that creep into the process before they cause nonconforming products. You use automatic control-limit assessment, control testing, and alarm notification to keep processes in check.
Improve
A process in statistical control doesn't guarantee quality output, only predictable output. A stable process may still not be capable of producing products that conform to specification. You can explore process data, find new ways to improve quality, and verify improvements using an analytical toolbox.
As you introduce new people, machinery, equipment, and methods into the process, the control charts are the first indicators of success. Quality helps you recharacterize and restabilize the process at new levels of performance.
With Quality, you can manually gather any combination of variable and attribute data using point-and-click pick lists for traceability items. Characteristics can have different subgroup sizes, control charts, and control rules, all within the same data-entry session. During data entry, characteristics can also be derived. For example, you can enter measurements for two characteristics (width and length) while a third measurement (area) is automatically calculated using a predefined formula; for example, width * length.
Quality also offers an XML-based publish and subscribe architecture to automatically collect data from any measurement device or electronic data-collection system.
As soon as you enter data, Quality evaluates it for specification and control-chart violations. You can instantly view the charts or graphics anytime during the data-collection process. Control violations can also be routed to offline personnel, who can review the data and chart information and determine if support action is necessary.
Identifying Causes and Taking Corrective Actions
With data-collection pages, users provide information on what may have caused an out-of-control problem and on the corrective action that they took. This information is also available to offline support personnel, who can review or add causes, actions, and comments. This information is associated with the subgroup and stored in the database for further analysis and review.
Managing Alarms
Each time a subgroup violates a statistical test or an individual measurement is out of specification, an alarm occurs. You can send alarms to a worklist or through electronic mail, using Workflow. You can view details for an alarm, add corrective action and comments, review representative charts, and close out the alarm.
You use Quality to configure the quality-control environment by identifying each process control and data-collection point. To configure what you want to control and how you want to control the process:
Define quality control requirements.
Quality functions determine which fields are available for data entry or query. They also provides parenting for related process hierarchies and their associated streams. When defining the quality function, you determine the trace and hierarchy fields that are common to that quality application or functional area. When recording inspection data against a sampling, hierarchy fields determine the data that you are entering sampling results against. You use trace fields to enter traceability information, such as the lot number associated with that sampling.
Measurement plans represent groups of characteristics that form measurement criteria for inspection and control. When defining characteristics for a measurement plan, you determine the properties of the characteristic being measured, the subgroup size, how to display the data on charts, and the quality control rules to apply for each characteristic.
Control plans bring together application, measurement, and control-and-response criteria for a specific product and process. Up until this point, all elements of configuration that you have established haven't been applied to a specific process. The control plan provides the remaining element of configuration, defining the process and applying methods of inspection and control to that process.
When defining a control plan, you reference a quality function that indicates the fields to display as hierarchy fields on the plan. Then, for each individual hierarchy field combination, you define the measurement plan that applies.
Construct control charts.
Quality includes standard control charts you use to define specialized charts with formulas, labels, and test zones. Each component of the chart can contain requirements. For example, the point on the chart can be subtracted from the nominal specification value before being plotted, or control limit formulas may contain a special constant to achieve 2.5 sigma control limits.
Create diverse control rules.
If the organization has unique or non-standard procedures for evaluating process control or limit calculations, you can define these same procedures within Quality.
You can create control tests from Shewhart prototypes and selectively apply the tests to mean or variance charts. The tests are evaluated when performing data-entry functions. You can control the sensitivity of each test by specifying the number of points to be evaluated and the number of points in the pattern required to trigger a violation.
You can also employ a three-level phased approach for establishing control limits by setting them to automatically calculate at 10, 20, and 30 subgroups. This gives the operation a moderate level of control at 10 to 29 subgroups and fixed control at 30. You can also automatically recalculate at a specified point interval.
Using Quality, you can view control charts, histograms, Pareto charts, and more. In addition, you can assemble a variety of graphics, charts, and statistical tables for reports and documents. Use the extraction process to build reusable queries that produce a concise dataset automatically filled with the appropriate control limits, specifications, and other relevant quality information. Along with the sorting and filtering capabilities for defining an extraction, you can also use mechanisms built directly into the analysis tools to explore the dataset.
You can perform offline interactive analysis in the Quality application client. The Quality application client is an analytical software service module that enables you to display, manage, and analyze quality data. Using the application client, you can create datasets and export results directly into spreadsheets to further analyze process data.
You can use a dataset created by extracting data from the database, and you can add more data, modify existing data, or delete data in a what-if scenario. For example, to see results of a new sampling or control scheme, you can change information locally in a control chart and examine the results. Based on the results, you can put the new process into active production or discard the dataset. The results are never written to the database, but you can save them to a file.
These options are instantly available using buttons on the Quality application client toolbar:
Control chart
Provides charts for variable and attribute data, including XB/R, XB/s, X/MR, p, u, c, and np. You can build additional control charts, such as precontrol or hybrid. Functions and display settings include selecting chart points, sweep points for details, display alarms, and change control limits.
Histogram
View the distribution of the data, view key statistics, test for normality, and apply Pearson criteria for non-normal distributions. You can select cells, display box plots, sweep cells for boundaries, count, and percent, display curve fits, and overlay specifications.
Pareto chart
View the top defects, probable causes, corrective actions, or control test violations. You can use filtering and redraw options to display cumulative percentages, display top n cells, order cells, and display cell totals.
Bar graph
Compare statistical values among multiple characteristics. You can group the characteristics by machines, work centers, stations, or other components, for unique within-process comparisons. You can view the results in ascending or descending order and mark the minimum and maximum bars and set scales.
Box plots
Compare several distributions simultaneously. You can view data by Box and Whisker plots, boxed capability graphs, or simple minimum/maximum plots. You can also display statistical summaries, overlay six sigma regions, and modify graphic scales.
Line graph
Overlay up to six lines of data in one display. You can also connect lines, observe for trends, sweep points for details, and display symbols.
Statistical Matrix
Displays information about the dataset. With the statistical matrix format, you can view tabular-formatted statistics related to one or more subsets of the dataset.