Using Line Graphs
This topic discusses how to use Line graphs.
|
Page Name |
Definition Name |
Usage |
|---|---|---|
|
None |
Display trends of individual measurement values. |
|
|
None |
Modify settings and display characteristics for the active line graph window. |
Use the Line Graph panel to display trends of individual measurement values.
Navigation:
Click the Line Graph button.
This example illustrates the fields and controls on the Line Graph panel. You can find definitions for the fields and controls later on this page.
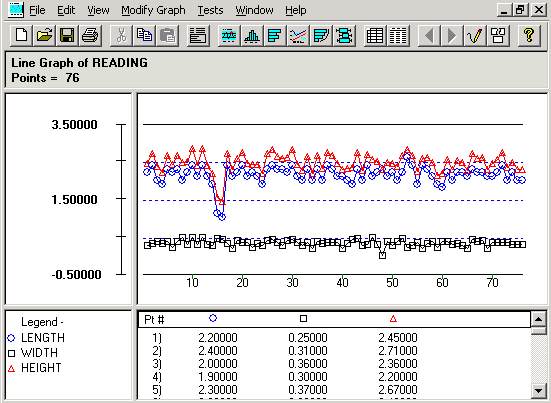
The line graph comprises multiple graph panes (sections) displaying information about the subset that you are examining. All subsets that you are comparing are overlaid on the same graph. You can select individual points on the line graph display to examine details.
When you click points on the graph section, a yellow vertical bar highlights the points. The corresponding values for the points are displayed in the detail section of the chart, with a single point for each subset. To move the yellow vertical bar:
Drag it.
Use the Left Arrow and Right Arrow keys on the keyboard.
To remove the yellow highlight bar, drag it to the far left or the far right of the chart.
Resize the sections the same as you resize histogram sections. All subsets are overlaid in the line graph, so you can view them at the same time. You can examine the graph with or without connecting lines or points.
Title Section
This section displays the label of the graph being displayed for a specific column, such as READING. The title section also displays the maximum number of points drawn on the graph.
Scale Section
This section indicates the numeric values for the scale used for the graph. Scales are usually calculated based upon the minimum/maximum observations for the subsets selected, but you can change the scale limits using the Modify Line Graph dialog box.
Graph Section
This section displays a line for each subset that you selected in the Selector panel. For example, if you selected three subsets, the system displays three lines on the line graph. Each line has a different geometric shape for its point indicator, and a different color.
Legend Section
This section displays the geometric shape and color that represent each subset on the line graph.
Detail Section
This section displays the individual data values for the points in each subset.
Use the Modify Line Graph dialog box to modify settings and display characteristics for the active line graph window.
Navigation:
Open a line graph.
You can modify the line graph by resizing the sections to adjust the amount of display information, changing the display lines and points, and changing the graph scale.
Any changes you make to the line graph are in effect only for the active chart. If you open a second line graph window, the changes are not in effect.
Field or Control |
Description |
|---|---|
Fit Points to Window |
Select to expand the graph to fit the full size of the Line Graph panel, eliminating the horizontal scroll bar. |
Draw Connecting Lines |
Select to display the lines that connect each point on the graph. |
Draw Points |
Select to display the points on each line in the graph. |
Scale Limits |
Enter values for the lower and upper scale limits. |