Enabling Application Engine Tracing
By default, all Application Engine traces are turned off. To see a trace or a combination of traces, set trace options before you run a program.
This section discusses how to:
Set command line options.
Set parameters in server configuration files.
Set client options in Configuration Manager.
Enable selective tracing
The command line option is available for Microsoft Windows NT and UNIX, but it is not available when calling Application Engine programs from PeopleCode.
To enable tracing from the command line, specify the −TRACE option within the command line that you submit to PSAE.EXE. For example:
n:\pt840\bin\client\winx86\psae.exe -CT MICROSFT -CD PT800GES -CO PTDMO
 -password PTDMO -R PT8GES -AI AETESTPROG −I 45 -TRACE 2
The following table describes the available TRACE option parameter values:
|
Value |
Description |
|---|---|
|
0 |
Disables tracing. |
|
1 |
Initiates the Application Engine step trace. |
|
2 |
Initiates the Application Engine SQL trace. |
|
4 |
Initiates the trace for dedicated temporary table allocation to an Application Engine trace (AET) file. You can trace how the system allocates, locks, and releases temporary tables during program runs. |
|
8 |
Initiates the trace for temporary table data. Should be used together with AET file analyzer to display the rows affected by insert/update/delete SQL statements. |
|
128 |
Initiates the statement timings trace to a file, which is similar to the COBOL timings trace to a file. |
|
256 |
Initiates the PeopleCode detail to the file for the timings trace. |
|
1024 |
Initiates the statement timings trace and stores the results in the PS_BAT_TIMINGS_LOG and PS_BAT_TIMINGS_DTL tables. |
|
2048 |
Requests a database optimizer trace file. |
|
4096 |
Requests a database optimizer to be inserted in the Explain Plan table of the current database. |
|
8192 |
Sets a trace for PeopleSoft Integration Broker transform programs. |
|
16384 |
Initiates a SQL timings trace and stores the results in the PS_AE_TIMINGS_LG and PS_AE_TIMINGS_DT tables. |
To specify traces on the command line, you enter the sum of the desired trace options. This action is similar to adding the trace values using PSADMIN, such as the COBOL statement timings or the SQL statement trace value. To specify a combination of traces, enter the sum of the corresponding trace values. For example, to enable the step (1), the SQL (2), and the statement timings (128) traces, you would enter 131, which is the sum of 1 + 2 + 128.
To disable tracing, explicitly specify −TRACE 0. If you do not include the −TRACE flag in the command line, Application Engine uses the value specified in the Process Scheduler configuration file or in Configuration Manager. Otherwise, the command-line parameters override any trace settings that may be set in Configuration Manager.
You can set the parameters in server configuration files of Application Server or PeopleSoft Process Scheduler server to enable tracing in them and to get the trace output of both SQL and PeopleCode in the Application Engine Trace (AET) file. You can also set parameter to enable the trace output of sections in Application Engine programs.
Enabling Traces for Application Server and Process Scheduler Server
You can also enable traces in the configuration files for both the application server and the PeopleSoft Process Scheduler server.
For programs invoked by PeopleCode and run on the application server, set the TraceAE parameter in the Trace section of the Application Server configuration file (PSAPPSRV.CFG). You can use PSADMIN to set this parameter.
In the PeopleSoft Process Scheduler configuration file, set the TraceAE parameter in the Trace section to indicate a level of tracing. You can use PSADMIN to set this parameter.
This option is available on Microsoft Windows NT and UNIX, and it applies only to Application Engine programs invoked in batch mode.
Note: The TraceFile parameter does not specify the location of the Application Engine trace file; it applies only to the generic PeopleTools SQL and PeopleCode traces.
Combining PeopleCode and SQL Trace into AET file
You can combine PeopleCode and SQL Trace into AET file. You can set the TraceAECombineOutput parameter in server configuration file of Application Server or Process Scheduler Server to enable this feature.
The default value of this parameter is set to “N”. You can set the parameter, to a value of “Y” to merge SQL/PeopleCode trace into AET file.
For processes running on a Microsoft Windows workstation, you can set trace options using the Trace tab in PeopleSoft Configuration Manager. This procedure is valid only if you are running Application Engine programs on a Microsoft Windows workstation in a development environment.
Here, you can also define the file size of the trace file.
This example illustrates the fields and controls on the Application Engine Trace File Settings. You can find definitions for the fields and controls later on this page.
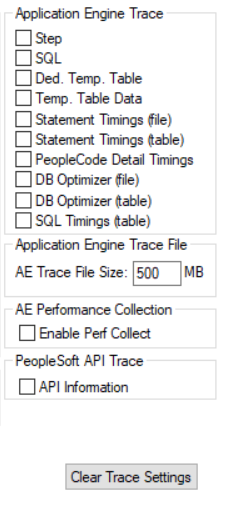
Application Engine Traces
To set Application Engine traces:
Start Configuration Manager, and select the Trace tab.
Select the appropriate trace options.
You can select any combination of options.
Click either the Apply or OK button to set trace options.
Temporary Table Data Trace
You can enable temporary table data tracing for diagnostics purposes. Use AE Trace Analyzer to analyze the temporary table trace file and generate diagnostic results.
To enable temporary table data tracing:
Select the Trace tab in PeopleSoft Configuration Manager.
Under Application Engine Trace, select Temp. Table Data.
Click either the Apply or OK button.
Note: The temporary table data trace file size can be up to 1 GB to limit the memory usage. To support files exceeding 1 GB size, increase the JVM heap size.
Note: To map the Application Engine steps logged in the AET file with the corresponding temporary table data output in the temporary table data, you can time stamp the Application Engine step’s start as an index. Use this time stamp to view the temporary table data of the desired Application Engine step.
The naming convention of AE trace file is AE_Program_name_Process_Instance_Date/Time_Stamp.AET, for example, AE_AP_MATCH_142879_1126204755.AET, and corresponding temporary table data trace file is AE_Program_name_Process_Instance_Date/Time_Stamp_temptable.DAT, for example, AE_AP_MATCH_142879_1126204755_temptable.DAT.
You can also enable the trace output of sections from PeopleSoft Configuration Manager. To enable the section trace output:
Select the Trace tab in PeopleSoft Configuration Manager.
Select the Enable Section Trace(g) check box.
Application Engine Trace File Size
The Application Engine Trace file size can get too large making it hard to open and read. You can define the maximum file size for the file in AE Trace File Size field. The default value of the Application Engine trace file size is 500 MB.
The file size can vary between 500 MB to 1500 MB. If the current Application Engine trace file size exceeds the user defined value, file is closed and logging is switched to a new trace file.
You can enable selective tracing for PeopleCode or SQL trace output.
You can select any section, step, or action of an Application Engine program for selective tracing.
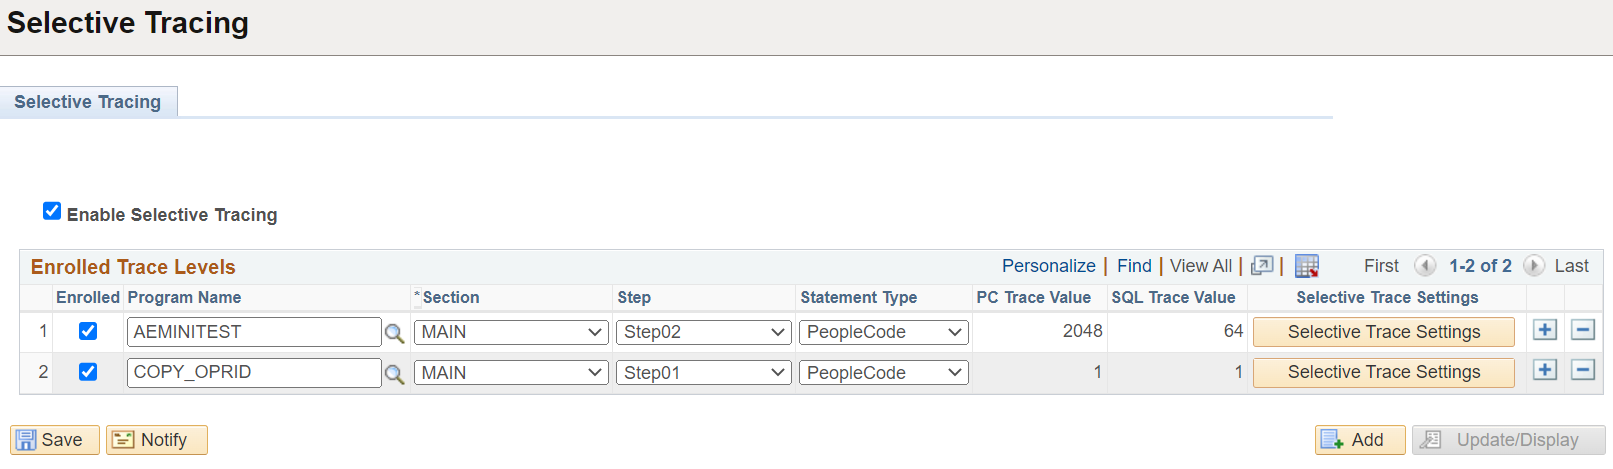
To enable selective tracing in PIA, navigate to .
This example illustrates the fields and controls on the Selective Tracing page.
|
Field |
Description |
|---|---|
|
Enable Selective Tracing |
Enable or disable selective tracing. |
|
Enrolled |
Select this option to enroll an Application Engine program. Only Application Engine programs that have a MAIN section is listed. |
|
Section |
This is enabled only when an Application Engine program is selected for selective tracing. |
|
Step |
This is enabled when you select a section. The steps are displayed based on the section you select. |
|
Statement Type |
This is enabled when you select a step. The statement types can be PeopleCode or SQL. |
|
PC Trace Value |
The PeopleCode trace value is displayed, which is selected from the Selective Trace page. |
|
SQL Trace Value |
The SQL trace value is displayed, which is selected from the Selective Trace page. |
|
Selective Trace Settings |
Use this to select the different PeopleCode trace and SQL trace settings for each AE program that is enrolled to use selective tracing. Refer to the subsequent section on PeopleCode and SQL trace settings. |
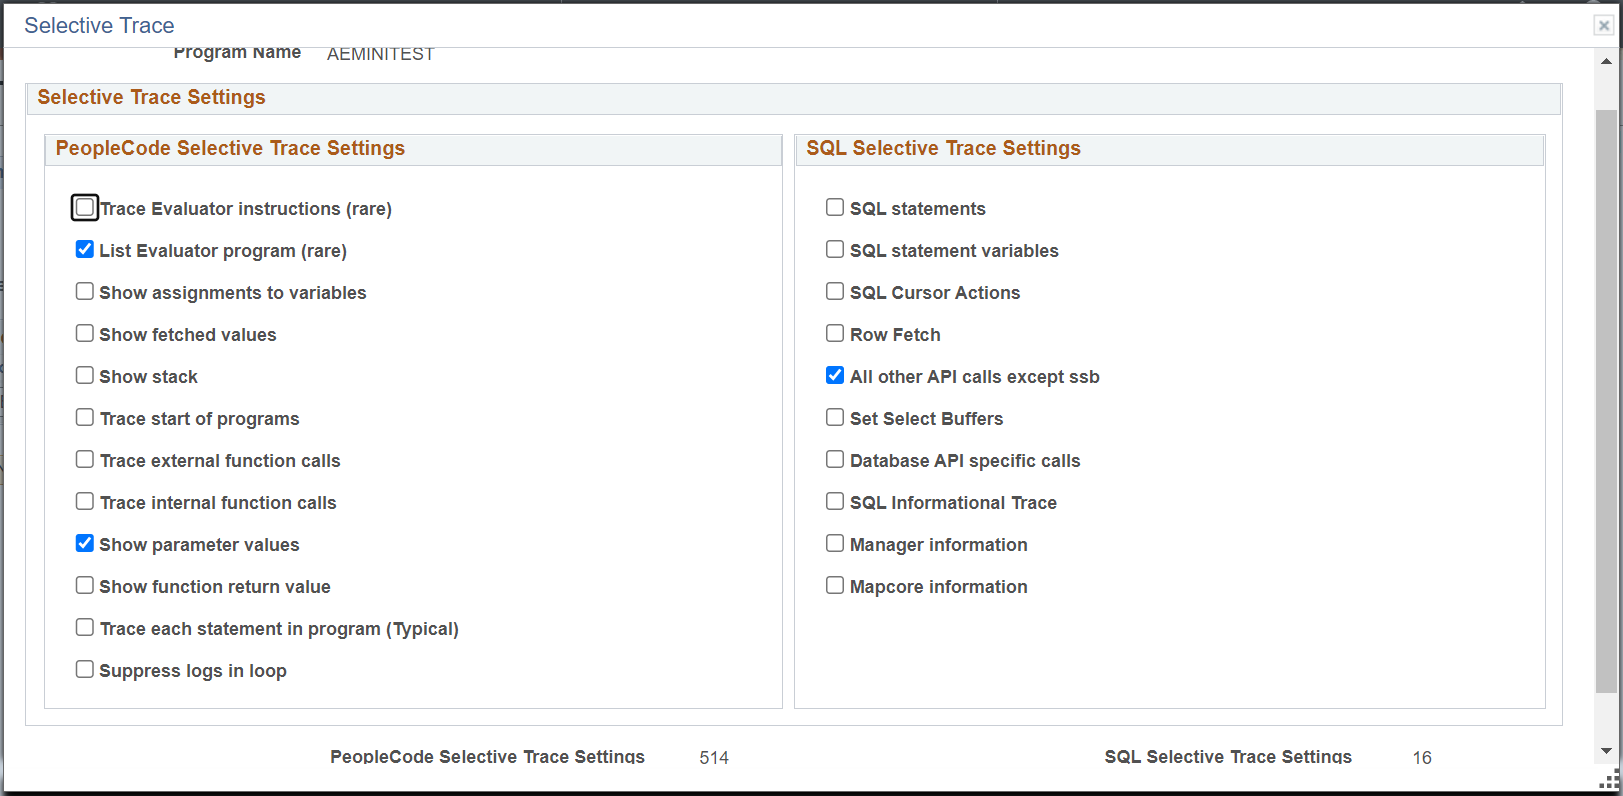
PeopleCode and SQL Trace Settings
You can select the PeopleCode trace and SQL trace settings from this page. The trace value appears at the bottom of this Selective Trace page.
After the selecting the trace settings on this page, the trace values then appear on the PC Trace Value and SQL Trace Value fields on the Selective Tracing page.
The values depend on the traces that you select. The values cannot be manually edited.
This example illustrates the fields and controls on the Selective Trace page.
Administrator Enabled Selective Tracing
From Selective Tracing Admin page, an administrator can specify selective tracing configuration for an user or a set of users by using the Enrolled Users link.
Navigate to .
This example illustrates the fields and controls on the Selective Tracing Admin page.
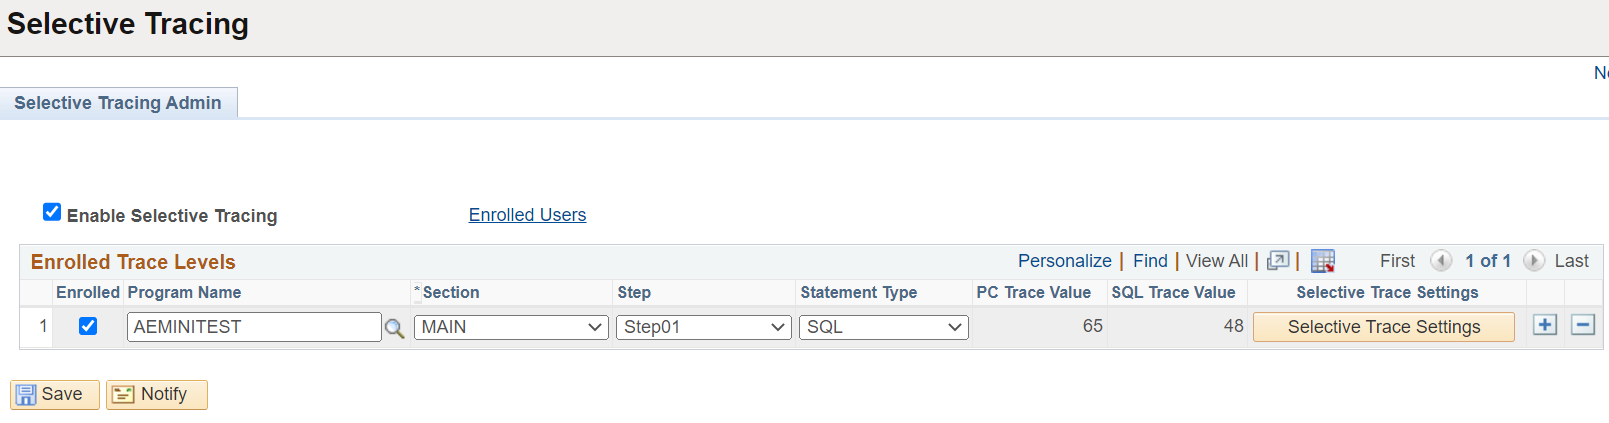
On this page, you can enroll the selected Application Engine program with the trace settings for an user or a set of users.
Select the Enrolled Users link to open the Selective Tracing page.
This example illustrates the fields and controls on the Selective Tracing Admin page.
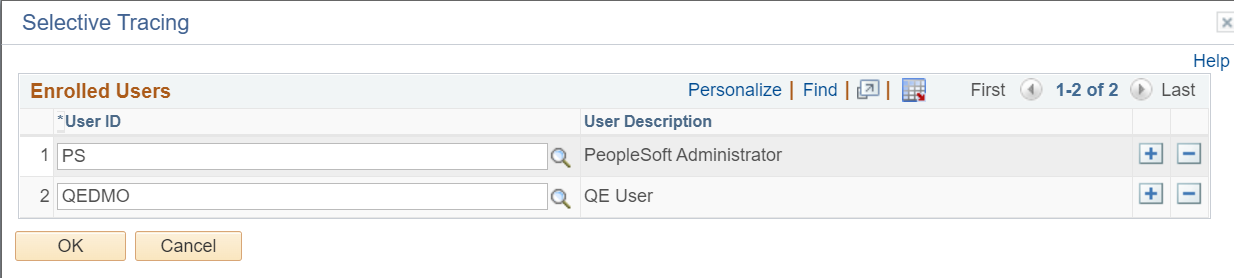
On this page, enroll an user or a set of users for whom you want to specify the selective tracing configuration.
When administrator enables selective tracing for an user from the Selective Tracing Admin page, then on the Selective Tracing page (PeopleTools, Application Engine, Selective Tracing) of that user, the administrator-enabled selective tracing settings appear in display-only mode.
Any trace setting done by the user on the Selective Tracing page will still be editable.
Note: The administrator's trace setting may override the user trace setting and the user trace setting will not be shown.