Using and Demonstrating JSMCAPI
To demonstrate MCF consoles and tools that use JSMCAPI, use the CTI Sample Pages (PT_CTI_DEMOOUTB) and MCF Sample Pages (MCF_DEMO_CMP) components.
The JSMCAPI enables custom configuration of MCF consoles (including the CTI console), MCF functionality on a PeopleSoft Pure Internet Architecture page, and queue and agent monitoring. For example, developers can create supervisor dashboards with which to monitor activity on their channels of interest, or developers can modify consoles according to their company's business requirements. The JSMCAPI builds on the REN JavaScript client. JSMCAPI uses standard JavaScript.
PeopleSoft provides sample pages demonstrating the functionality that is enabled by JSMCAPI. These pages are for demonstration purposes only, and should not be used in a production environment.
JSMCAPI is delivered with PeopleTools; you do not need a separate installation. The jsmcapi.js file is located in the <PIA_HOME>\webserv\<domain>\applications\peoplesoft\PORTAL\ps\pMCF folder.
Understanding Reason Objects and Reason Codes
PeopleSoft MCF provides reason codes to explain any error or an event that has happened. The third party vendors uses the same reason codes as provided by PeopleSoft MCF to create reason objects that they send with the events. PSMCAPI internally parses the event, gets the reason code, and sends it to JSMCAPI with the event. The CTI sample console or third-party multichannel console looks up a mapper table that maintains the mapping of the reason codes to the Message Catalog entries and displays the reason code messages associated with the error or event that was sent by PSMCAPI.
To display the reason code messages, the sample console picks up all the reason codes and reason messages from the Message Catalogue. Whenever an error occurs, the JavaScript function will extract the reasoncode from the reason object in event and look for the reason message. Then, the JavaScript code prepares the reason message from the fields of reason object and displays the reason message in a new small window.
Reason codes can also be send with requests from JSMCAPI side. The JavaScript function will prompt for the reason codes and any extra data as part of reason.
The following table lists the reason codes and their corresponding reason messages:
|
Reason Code |
Description/Message Entry |
|---|---|
|
0 |
System or general error has occurred. |
|
1 |
See provider for details. |
|
2 |
Extension or agent is busy. |
|
3 |
No answer. |
|
4 |
Task is in transfer. |
|
5 |
Task is in conference. |
|
6 |
Task is abandoned. |
|
7 |
Searching for an agent. |
|
8 |
Incoming task. |
|
9 |
Task is assigned. |
|
10 |
Connection is established. |
|
11 |
User or Task data is updated. |
|
12 |
Request is completed successfully. |
|
13 |
State of the agent, group, or extension changed. |
|
14 |
New task is initiated. |
|
15 |
Conference is not successful. |
|
16 |
Transfer is not successful. |
|
17 |
Retrieve is not successful. |
|
18 |
Forward is not successful. |
|
19 |
Reject is not successful. |
|
20 |
Revoke is not Successful. |
|
21 |
Task is revoked. |
|
22 |
Task is withdrawn. |
|
23 |
Do Not Disturb is turned on. |
|
24 |
Do Not Disturb is turned off. |
|
25 |
Forwarding of calls is set. |
|
26 |
Forwarding of calls is canceled. |
|
27 |
Phone is on hook. |
|
28 |
Phone is off hook. |
|
29 |
New call is initiated. |
|
30 |
Call is put on hold. |
|
31 |
Call is parked. |
|
32 |
Call is cleared. |
|
33 |
Call is alternated between hold and active states. |
|
34 |
Call is taken off hold. |
|
35 |
Hold is not successful. |
|
36 |
Invalid session. |
|
37 |
Invalid State. |
|
38 |
Incorrect Data. |
|
39 |
Unsupported Feature. |
|
40 |
Configuration Error. |
|
41 |
Server is on. |
|
42 |
Server is off. |
|
43 |
Agent is Busy. |
|
44 |
Unexpected Error. |
The following table maps the reason codes to the entries in the Message Catalog:
|
Message Number MCFMSGNUM |
Message Set Number MCFMSGSETNUM |
Reason Code Number REASONCODENO |
|---|---|---|
|
2790 |
162 |
0 |
|
2791 |
162 |
1 |
|
2792 |
162 |
2 |
|
2793 |
162 |
3 |
|
2794 |
162 |
4 |
|
2795 |
162 |
5 |
|
2796 |
162 |
6 |
|
2797 |
162 |
7 |
|
2798 |
162 |
8 |
|
2799 |
162 |
9 |
|
2800 |
162 |
10 |
|
2801 |
162 |
11 |
|
2802 |
162 |
12 |
|
2803 |
162 |
13 |
|
2804 |
162 |
14 |
|
2805 |
162 |
15 |
|
2806 |
162 |
16 |
|
2807 |
162 |
17 |
|
2808 |
162 |
18 |
|
2809 |
162 |
19 |
|
2810 |
162 |
20 |
|
2811 |
162 |
21 |
|
2812 |
162 |
22 |
|
2813 |
162 |
23 |
|
2814 |
162 |
24 |
|
2815 |
162 |
25 |
|
2816 |
162 |
26 |
|
2817 |
162 |
27 |
|
2818 |
162 |
28 |
|
2819 |
162 |
29 |
|
2820 |
162 |
30 |
|
2821 |
162 |
31 |
|
2822 |
162 |
32 |
|
2823 |
162 |
33 |
|
2824 |
162 |
34 |
|
2825 |
162 |
35 |
|
2826 |
162 |
36 |
|
2827 |
162 |
37 |
|
2828 |
162 |
38 |
|
2829 |
162 |
39 |
|
2830 |
162 |
40 |
|
2831 |
162 |
41 |
|
2832 |
162 |
42 |
|
2833 |
162 |
43 |
|
2834 |
162 |
44 |
This section discusses common elements used on the CTI sample pages.
Common Elements Used in CTI Sample Pages
The following common elements are used in CTI sample pages.
Field or Control |
Description |
|---|---|
Agent Id |
Select the CTI or MCF agent's agent ID. In the case of a CTI agent, the agent ID may be different from the agent's user ID. |
g/e/c (generic, email, chat) |
Represents three task types: generic, email, chat. |
|
Click to initiate the action that is selected in the associated drop-down list box. |
MCF Cluster ID |
Select the MCF cluster to be monitored or on which to test the sample console. |
Physical Queue |
Select the physical queue to be monitored. Each MCF logical queue can comprise one or more physical queues. Because each physical queue is associated with an MCF cluster, only physical queues can be monitored. |
State |
Displays a value indicating the state of the associated element. |
Statistics |
Display statistics that are generated by the CTI server. |
User Id |
Displays the CTI agent's PeopleSoft user ID. |

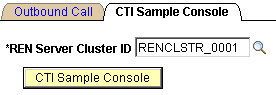
Access the CTI Sample Console page using the following navigation path:
This example illustrates the fields and controls on the CTI Sample Console page. You can find definitions for the fields and controls later on this page.
Field or Control |
Description |
|---|---|
REN Server Cluster ID |
Select the REN server cluster on which to test the sample console. |
CTI Sample Console |
Click to initiate the sample console. Note: To demonstrate the CTI sample console, you must have a CTI server running and communicating with the specified REN server cluster. |
After clicking CTI Sample Console, a new browser window appears that displays the sample console along with a tracer window. The Sample CTI Console contains the following group boxes which are explained in detail in the following sections:
Open/Close Session
Register User to Session
Register Group, Login User to Group, and User-Group States
Register Extension to Session, and Extension Operations
Buddies
Error Message/Information
Server State and Broadcasts
Note: To enable the new browser window to appear, disable any pop-up blocking software for your browser.
Open/Close Session
Access the Open/Close Session group box.
This example illustrates the fields and controls on the Open/Close Session group box. You can find definitions for the fields and controls later on this page.
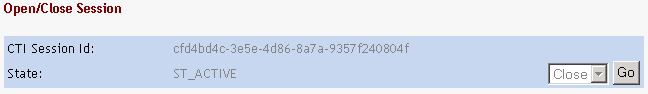
The Open/Close Session group box displays information about the session.
Field or Control |
Description |
|---|---|
CTI Session Id |
This field displays a value identifying the session. If no session ID is displayed, check to ensure that the CTI server and REN server are both running. |
You can close an active session by clicking the Go button. You cannot make a selection from the drop-down list box.
Register User to Session
Access the Register User to Session group box.
This example illustrates the fields and controls on the Register User to Session group box. You can find definitions for the fields and controls later on this page.
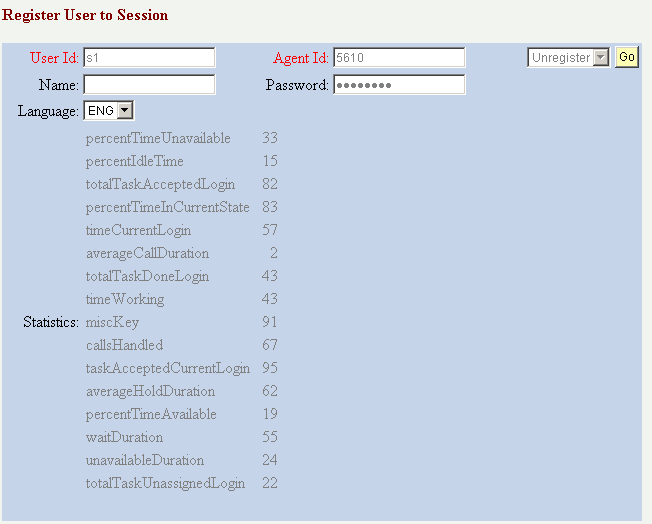
Register a user to the session in the Register User to Session group box.
Because a CTI agent can have an agent ID different from the agent's user ID, both values are required. If the agent has a password, the password is also required.
Field or Control |
Description |
|---|---|
Language |
Reserved for future use. The default language is English. |
You can register or unregister an agent by clicking the Go button. You cannot make a selection from the drop-down list box.
Register Group, Login User to Group, and User-Group States
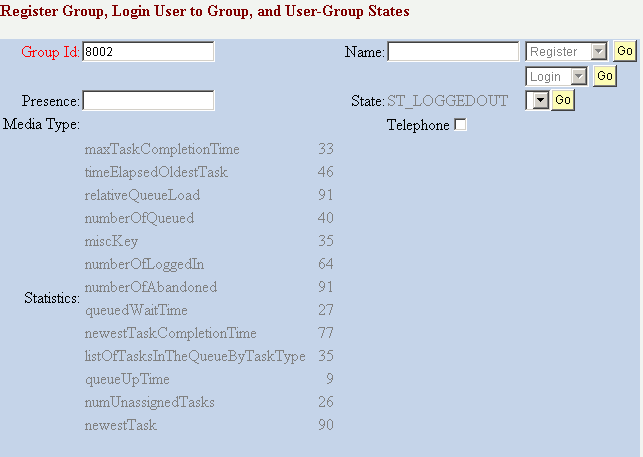
Access the Register Group, Login User to Group, and User-Group States group box.
This example illustrates the fields and controls on the Register Group, Login User to Group, and User Group States group box. You can find definitions for the fields and controls later on this page.
Field or Control |
Description |
|---|---|
Group Id |
Enter the group ID to which the agent will be registered. To register the agent with the specified group, click the Go button. You cannot make a selection from the drop-down list box. |
Login |
Click the Go button to log in if Login appears in the drop-down list box. Click the Go button to log out if Logout appears in the drop-down list box. Note: The agent cannot receive calls until the agent is in the Ready state. Note: After you login to the group, a new pop-up window opens prompting for reason code data. If you register to an invalid group, the system displays an error message. |
Presence |
Enter a presence description to associate with the state that is selected in the drop-down list box. This presence value is different from any presence values that are predefined in the agent configuration. The agent cannot select from the pre-defined values. |
State |
Select an agent state. State options are:
Each state value has an associated state code that appears in the State field. To enable incoming calls, select Ready from the drop-down list box and click the Go button. |
Media Type |
Reserved for future use. The sample console supports only the telephone (voice) channel. However, JSMCAPI can support other channels. |
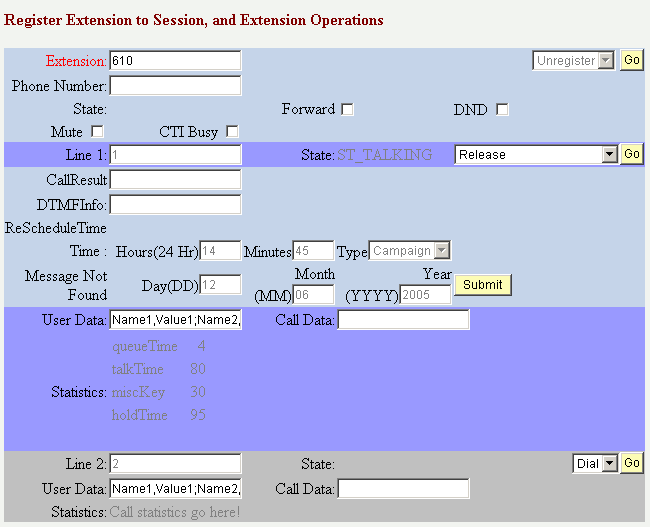
Register Extension to Session and Extension Operations
Access the Register Extension to Session, and Extension Operations group box.
This example illustrates the fields and controls on the Register Extension to Session and Extension Operations group box. You can find definitions for the fields and controls later on this page.
Field or Control |
Description |
|---|---|
Extension |
Enter a valid telephone extension number. |
Phone Number |
Enter a valid telephone number for use in subsequent operations, such as dial, forward, or do-not-disturb (DND). |
Mute |
Select to mute a call. Note: This is enabled only when the agent is on a call. |
CTI Busy |
This flag is checked by the queue server for an agent handling a voice task. Note: If the flag is checked, the queue server will not assign new tasks to such an agent. The CTI Busy flag allows the application to implement a request which conveys the status of the agent to the queue server. Because the queue server stores the task list and the status in its temporary cache, a recovered or a rebooted queue server will not have the information of a agent's previous CTI status. The agent can send its CTI status to the queue server to indicate that it is busy with a CTI task. |
Forward |
Select to forward incoming calls to the specified number. |
DND (do not disturb) |
Select to put the selected extension in do-not-disturb status. |
Line 1 or Line 2 |
Displays a name or value for each line. On the sample console, the value will either be 1 or 2. |
DTMFInfo ( Dual-tone Multi frequency information) |
Select to send DTMF digits on the line |
CallResult |
Select to set call result on the line |
ReScheduleTime |
Select to set reschedule time on the line |
Type |
Select to set reschedule type on the line. |
User Data |
Enter name-value pairs representing user data to be attached to a call. |
Call Data |
Enter any call data to be attached to the call. Call data includes:
|
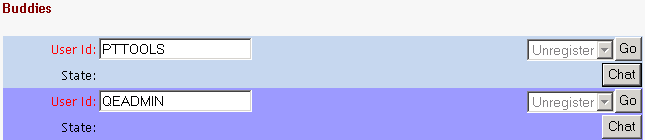
Buddies
Access the Buddies group box.
This example illustrates the fields and controls on the Buddies group box.
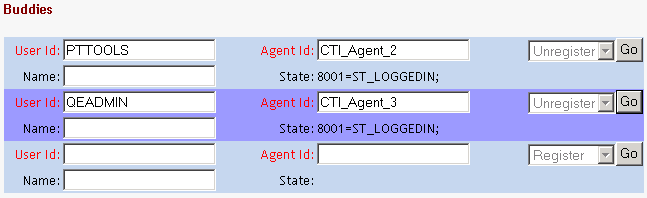
Before an agent can chat with a buddy, the buddy must be registered in the Buddies group box.
Because a CTI agent can have an agent ID that is different from the agent's user ID, both values are required.
Note: If one agent is logged on the multichannel console and another agent is logged on the sample pages, the agents may see an incorrect buddy state for each other.
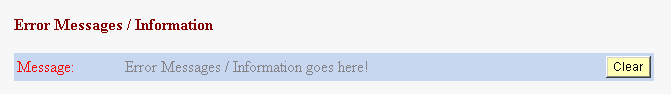
Error Messages/Information
Access the Error Messages/Information group box.
This example illustrates the fields and controls on the Error Messages/Information group box. You can find definitions for the fields and controls later on this page.

Any error messages associated with the process display in this section.
Field or Control |
Description |
|---|---|
Clear |
Click the button to clear a displayed error message. |
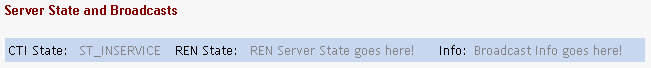
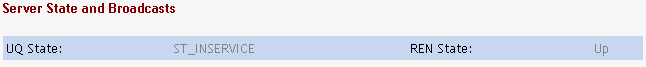
Server State and Broadcasts
Access the Server State and Broadcasts group box.
This example illustrates the fields and controls on the Server State and Broadcasts group box. You can find definitions for the fields and controls later on this page.
Field or Control |
Description |
|---|---|
CTI State |
Displays the status of the CTI server. |
REN State |
Displays the status of the REN server. |
Info (information) |
Displays the text of a broadcast message from the CTI server. |
Tracer
The tracer displays all requests between the CTI server and the console, which can be useful for debugging.
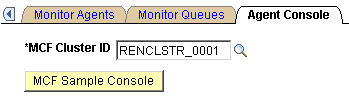
Access the Agent Console page using the following navigation path:
This example illustrates the fields and controls on the Agent Console page. You can find definitions for the fields and controls later on this page.
Field or Control |
Description |
|---|---|
MCF Sample Console |
Click to initiate the sample console. Note: To demonstrate the MCF sample console, you must have an MCF cluster running and communicating with the specified REN server cluster. |
After you click MCF Sample Console, a new browser window displaying the sample console appears along with a Tracer Window. The MCF Sample Page contains the following group boxes which are explained in detail in the following sections:
Open/Close Session
Register User to Session
Register Group, Login User to Group, and User-Group States
Address Operations
Buddies
Error Message/Information
Server State and Broadcasts
Note: To enable the new browser window to appear, disable any pop-up blocking software for your browser.
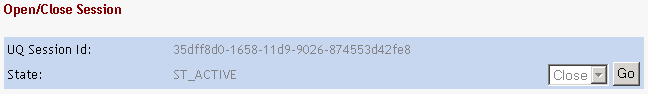
Open/Close Session
Access the Open/Close Session group box.
This example illustrates the fields and controls on the Open/Close Session group box. You can find definitions for the fields and controls later on this page.
Field or Control |
Description |
|---|---|
UQ Session Id |
The universal queue session ID. |
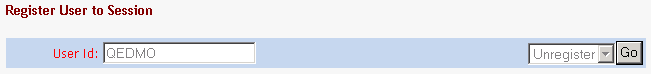
Register User to Session
Access the Register User to Session group box.
This example illustrates the fields and controls on the Register User to Session group box.
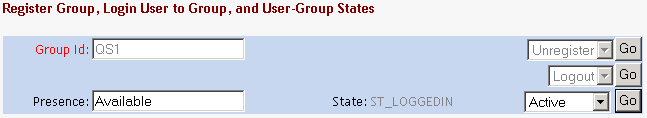
Register Group, Login User to Group, and User-Group States
Access the Register Group, Login User to Group, and User-Group States group box.
Note: The presence change happens only when you change from active to inactive or from inactive to active. When you log in, the default value is active and therefore no presence change occurs.
This example illustrates the fields and controls on the Register Group, Login User to Group, and User-Group States group box.
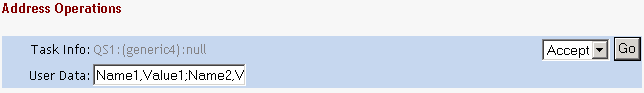
Address Operations
Access the Address Operations group box.
This example illustrates the fields and controls on the Address Operations group box.
Buddies
Access the Buddies group box.
This example illustrates the fields and controls on the Buddies group box.
Note: If one agent is logged on the multichannel console and another agent is logged on the sample pages, the agents may see an incorrect buddy state for each other.
Note: The buddy states on this page are not automatically displayed. You must monitor an agent first using the Monitor Agents page before the buddy states are displayed.
See Using the Monitor Agents Page and Sample Monitor - Agent States Page.
Field or Control |
Description |
|---|---|
|
Click to initiate an agent-to-agent chat session. |

Error Messages/Information
Access the Error Messages/Information group box.
This example illustrates the fields and controls on the Error Messages/Information group box.
Any error messages associated with the process display here.
Field or Control |
Description |
|---|---|
Clear |
Click the button to clear a displayed error message. |
Server State and Broadcasts
Access the Server State and Broadcasts group box.
This example illustrates the fields and controls on the Server State and Broadcasts group box. You can find definitions for the fields and controls later on this page.
Field or Control |
Description |
|---|---|
UQ State |
Displays the state of the queue server. |
REN State |
Displays the state of the REN server. |
Access the Monitor Agents page using the following navigation path:
This example illustrates the fields and controls on the Monitor Agents page.
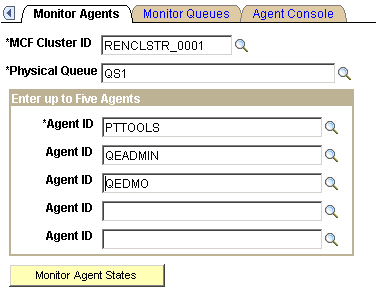
Select the MCF cluster, physical queue on that cluster, and up to five agents on that queue to be monitored.
After you click Monitor Agent States, a new browser window appears.
Note: To enable the new browser window to appear, disable any pop-up blocking software for your browser.
This example illustrates the fields and controls on the Sample Monitor - Agent States page. You can find definitions for the fields and controls later on this page.
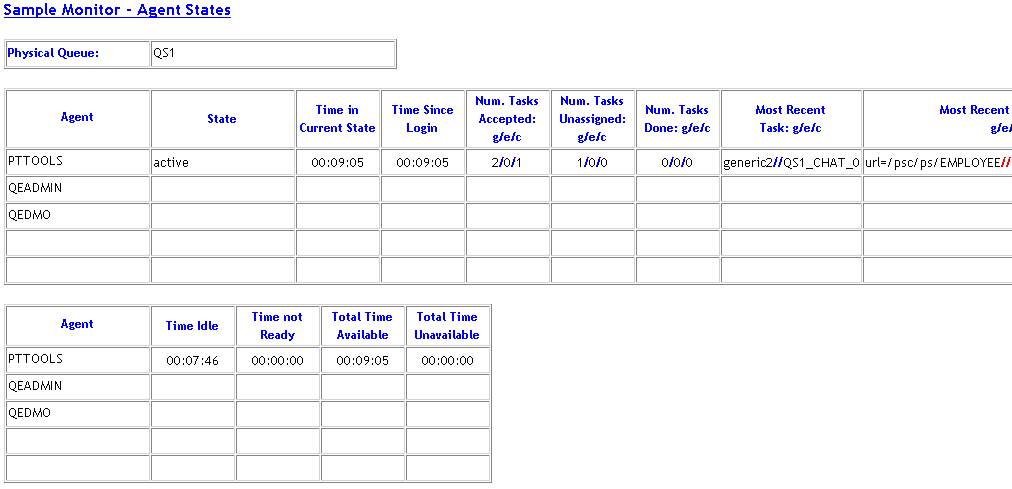
Physical Queue
The ID of the physical queue that is being monitored appears in the first table.
Agent Statistics Table 1
The first agent statistics table displays information that is published by the JSMCAPI user.onStat1 event.
Field or Control |
Description |
|---|---|
Time in Current State |
Displays the duration of the agent's current state. The value returned is |
Time Since Login |
Denotes the duration since the agent logged in. The value returned is |
Num. Tasks Accepted: g/e/c (number of tasks accepted) |
Displays the number of tasks in each task type that the agent has accepted since login. The value returned is |
Num. Tasks Unassigned: g/e/c (number of tasks unassigned) |
Displays the number of tasks in each task type that have been unassigned from the agent. Returned by |
Num. Tasks Done: g/e/c (number of tasks done) |
Displays the number of tasks in each task type that the agent has completed. Returned by |
Most Recent Task: g/e/c |
Identifies the most recent task that was accepted since login for each task type. Returned by |
Most Recent Task Data: g/e/c |
Displays data on the most recent task that was accepted since login for each task type. Returned by |
Agent Statistics Table 2
The second agent statistics table displays information that is published by the JSMCAPI user.onStat2 event.
Field or Control |
Description |
|---|---|
Time Idle |
Displays the duration of time during which the agent has been idle. An agent is considered to be idle from the time the agent logs on until the agent accepts a task, and during the time between completing the last accepted task and accepting another task. The value returned is |
Time not Ready |
Displays the duration of time during which the queue could not assign tasks to the agent because the agent's maximum workload has been reached. The value returned is |
Total Time Available |
Displays the total amount of time that the agent has been in an available status. The value returned is |
Total Time Unavailable |
Displays the total amount of time that the agent has been in an unavailable status. The value returned is |
Access the Monitor Queues page using the following navigation path:
This example illustrates the fields and controls on the Monitor Queues page.
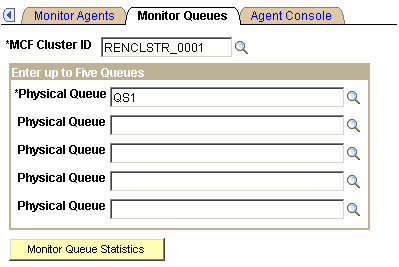
Select the MCF cluster and up to five physical queues on that cluster to be monitored.
After you click Monitor Queue Statistics, a new browser window appears.
Note: To enable the new browser window to appear, disable any pop-up blocking software for your browser.
This example illustrates the fields and controls on the Sample Monitor - Queue Statistics page. You can find definitions for the fields and controls later on this page.
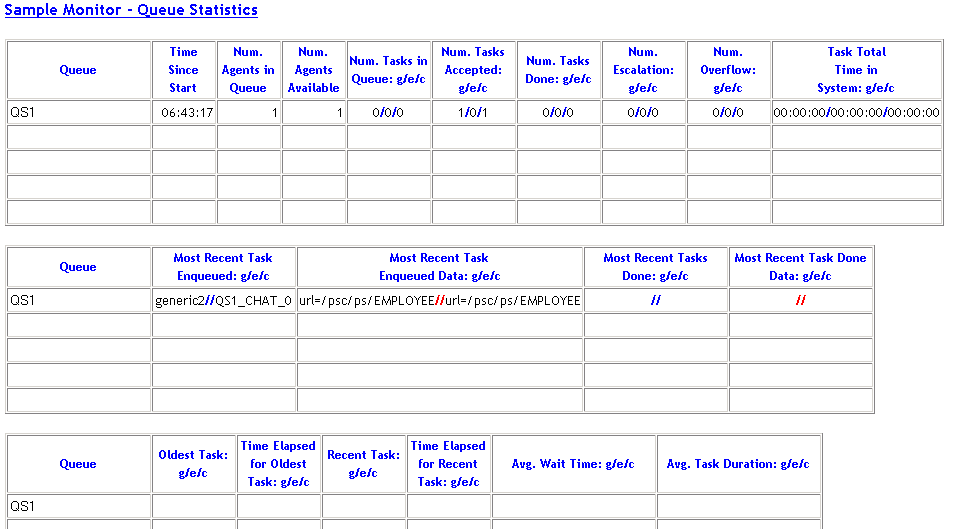
Queue Statistics 1
The first queue statistics table displays data that does not change frequently. The table displays information that is published by the JSMCAPI group.onStat1 event.
Field or Control |
Description |
|---|---|
Queue |
Displays an identifier for this queue. The value returned is |
Time Since Start |
The duration since this queue was started (application server domain start). The value returned is |
Num. Agents in Queue (number of agents in queue) |
The number of agents that are currently logged in to this queue. The value returned is |
Num. Agents Available (number of agents available) |
The number of agents that are currently logged in to this queue with an available status. The value returned is |
Num. Tasks in Queue: g/e/c (number of tasks in queue) |
The number of tasks that are currently on this queue, by task type. The value returned is |
Num. Tasks Accepted: g/e/c (number of tasks accepted) |
The number of accepted tasks that are currently on this queue, by task type. The value returned is |
Num. Tasks Done: g/e/c (number of tasks done) |
The number of tasks on this queue that have been completed, by task type. The value returned is |
Num. Escalation: g/e/c (number of escalation) |
The number of escalated tasks on this queue, by task type. The value returned is |
Num. Overflow: g/e/c (number of overflow) |
The number of overflow tasks on this queue, by task type. The value returned is |
Task Total Time in System: g/e/c |
Displays the total duration of the most recently completed task in the system. The total time is the difference between the time that the task was enqueued and the time at which it was marked done. The value returned is |
Queue Statistics 2
The second queue statistics table displays data that changes frequently. The table displays information that is published by the JSMCAPI group.onStat1 event.
Field or Control |
Description |
|---|---|
Most Recent Task Enqueued: g/e/c |
Identifies the task that was most recently enqueued on this queue, by task type. The value returned is |
Most Recent Task Enqueued Data: g/e/c |
Displays data for the most recently enqueued task on this queue, by task type. The value returned is |
Most Recent Tasks Done: g/e/c |
Identifies the task that was most recently completed, by task type. The value returned is |
Most Recent Task Done Data: g/e/c |
Displays data for the most recently completed tasks, by task type. The value returned is |
Queue Statistics 3
The table displays information that is published by the JSMCAPI group.onStat2 event.
Field or Control |
Description |
|---|---|
Oldest Task: g/e/c |
Identifies the oldest enqueued and accepted task on this queue, by task type. The value returned is |
Time Elapsed for Oldest Task: g/e/c |
Displays the duration that the oldest task on this queue has been enqueued, by task type. The value returned is |
Recent Task: g/e/c |
Identifies the most recent task that was enqueued and accepted on this queue, by task type. The value returned is |
Time Elapsed for Recent Task: g/e/c |
Displays the duration that the most recent task on this queue has been enqueued, by task type. The value returned is |
Avg. Wait Time: g/e/c (average wait time) |
Displays the average time between a task being enqueued and being accepted, by task type. The value returned is |
Avg. Task Duration: g/e/c (average task duration) |
Displays the average duration before a task is completed. The value returned is The average task duration is calculated by referencing a list of completed tasks. The size of that list is determined by the donelistsize parameter that is set on the Cluster Tuning page. |