Viewing Concurrent Signon Information
This section discusses how to view concurrent sign on informations.
In some situations, it is necessary to be able to track and monitor the number of users that sign on to the system concurrently. For example, if your site has implemented a cost-per-user access agreement, system administrators need a method to determine usage, and to ensure compliance with any service-level agreements. The Performance Monitor enables you to capture and store concurrent user information and display a graphical view of the number of users signed on to your system at a given time. The concurrent sign-in information is extracted from existing Performance Monitor user sign-in information, summarized, and stored separately for concurrent sign-in monitoring.
Access the Maintain Chart Data page (PeopleTools, Performance Monitor, History Concurrent Signon Chart, Maintain Chart Data).
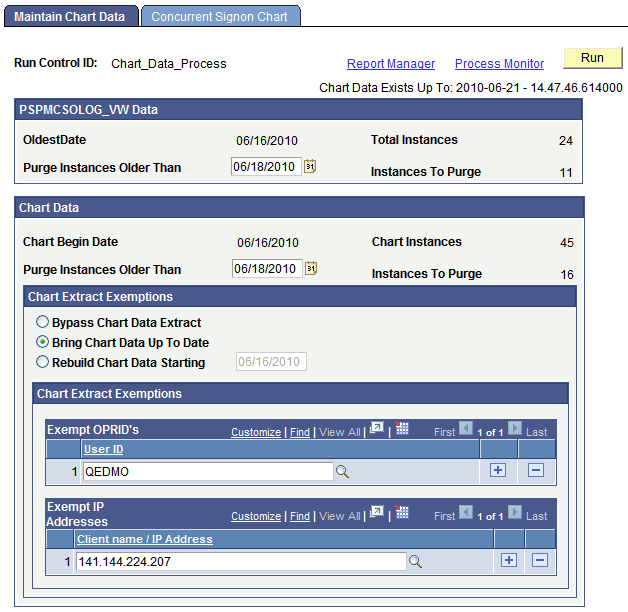
The Maintain Chart Data enables you to set the criteria by which you purge and extract the concurrent sign-in user data. Once your criteria has been set, click Run to launch the PSPMCSOSUM Application Engine program, which extracts summary information for PMU 108 (user session ended) and PMU 109 (user session began) from Performance Monitor PMU tables.
Note: When the PSPMCSOSUM Application Engine program runs, it does not manipulate or alter existing data for PMU 108 and PMU 109. It extracts the previously stored PMU 108 and PMU 109 data required by concurrent sign-in monitoring and inserts the data into tables used by concurrent sign-in monitoring. When you purge concurrent sign-in information, you do not delete stored PMU data—only the summary data stored for concurrent sign-in monitoring is purged.
This example illustrates the fields and controls on the Maintain Chart Data page. You can find definitions for the fields and controls later on this page.
Field or Control |
Description |
|---|---|
Run Control ID |
Because this page should only have limited access, the run control is not saved by user ID. A universal run control, Chart_Data_Process, exists for the PSPMCSOSUM Application Engine program. |
Chart Data Exists Up To |
Displays how current the sign-in data is. This the last time the PSPMCSOSUM Application Engine program ran. |
Oldest Date |
Displays the oldest date of stored sign-in summary data. |
Total Instances |
Displays the number of rows of extracted PMU summary information stored in the concurrent sign-in tables. |
Purge Instances Older Than |
To reduce the number of rows of stored PMU summary information, specify the date of the older rows that are no longer needed. |
Chart Begin Date |
Displays the date of the oldest rows being stored for the concurrent sign-in chart. |
Chart Instances |
Shows the number of rows of sign-in data being stored for displaying the concurrent sign-in chart. |
Purge Instances Older Than |
To reduce the number of rows of chart data, specify the date of the older rows that are no longer needed. |
Instances To Purge |
After specifying the chart data purge date, Instances to Purge displays the number of rows that will be deleted, showing the space you will reclaim. |
Bypass Chart Data Extract |
Select if you only need to run the purge functions of the PSPMCSOSUM Application Engine program. In this case, only the specified information will be purged, and no new information will be added to the chart data. |
Bring Chart Up To Date |
(Default) Extracts all concurrent sign-in information to update the chart data. |
Rebuild Chart Data Starting |
Select to build the chart using data starting after the date you specify. |
Exempt OPRID's |
To make specific user IDs exempt from appearing in chart data, add those IDs to this grid. For example, exempt IDs might include those used by administrators or consultants, not actually part of the user base or the service contract. |
Exempt IP Addresses |
To make logins from specific workstations exempt from appearing in chart data, add either the IP address or the workstation name to this grid. |
Access the Concurrent Signon Chart page (PeopleTools, Performance Monitor, History Concurrent Signon Chart, Maintain Chart Data).
Use this page to filter and view the concurrent signon chart.
This example illustrates the fields and controls on the Concurrent Signon Chart page. You can find definitions for the fields and controls later on this page.
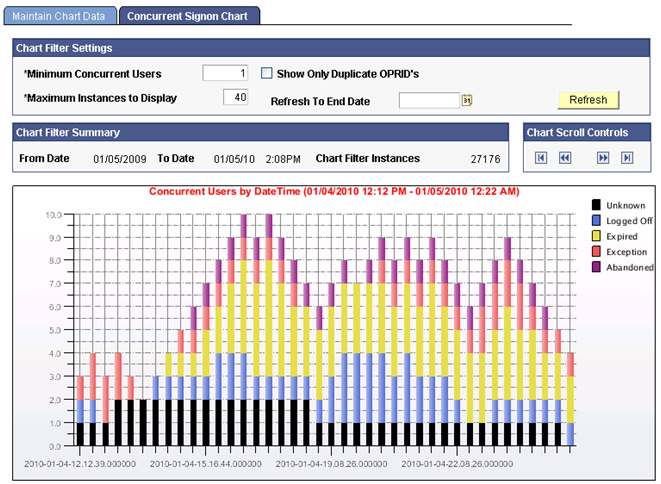
If you are not updating the existing chart table (PSPMCSO_CHART) and changing the parameters of AE program through concurrent signon page, then truncate PS_PSPMCSOAETEMP and PSPMCSO_CHART table before re-running the AE for correct results.
Field or Control |
Description |
|---|---|
Minimum Concurrent Users |
Specify the minimum amount of concurrent users to track. Any record of current usage below this limit will not be included in the chart content. |
Show Only Duplicate OPRID's |
Disables the Minimum Concurrent Users field and overrides its setting to 2. The chart content will be refreshed with only those instances where the same user ID was signed on to the system more than once in the given hour. |
Maximum Instances to Display |
Use this setting to control how much information to display on the chart at a time. When viewing a chart with 100 instances (rows of data), details can become obscured, and the drill down capability becomes less effective. The chart can display a maximum of 999 bars. |
Refresh To End Date |
Specify a particular date to position the chart so the very last data point for that day will be the last bar of the graph. This applies when the total number of rows in the chart data exceeds the Maximum Instances to Display value. |
Refresh |
Click to refresh the chart based on the most recent filter criteria. |
Chart Filter Summary |
Shows the information of the enter data set that can be displayed in the chart. |
Chart Scroll Controls |
Enables you to scroll through the data and display multiple charts if not all the data is displayed at once. The scroll buttons for First, Prev, Refresh, Next and Last enable you to update the display. The First button refreshes the Chart so that the very first data point available will be shown as the first bar of the graph (or will position to the First/Last Scroll Date if specified). When the Prev or Next Button is clicked the graph moves to the prior/next set of data based on the Maximum Instances to Display setting. |
Each instance (bar) in the chart displays hover text that describes the data the bar represents. You can drill down into each bar by clicking on it to display information similar to the following:
This example illustrates the fields and controls on the Concurrent Signon Drill-Down grid.
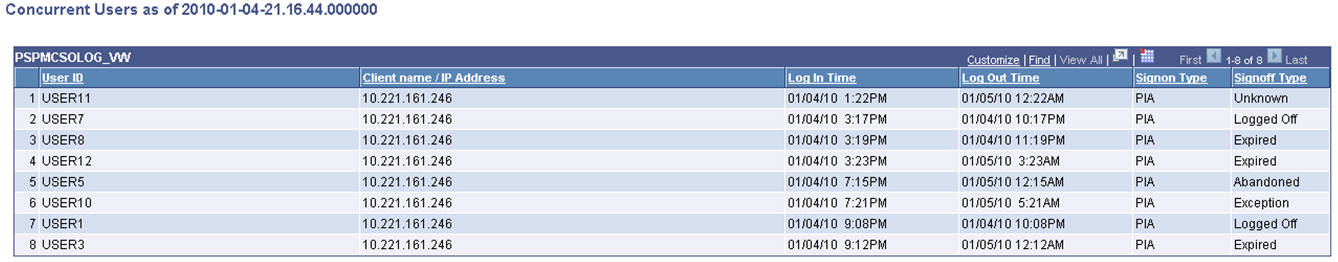
Note: In cases where a "switch user" occurred, the original user will be signed off at the same time the new user will be signed on. You can track and confirm this by drilling down into concurrent signon instances.