Viewing Performance Indices and Today's Average
Access the Indices and Today's Average page (PeopleTools, Performance Monitor, System Monitor, Indices and Today's Average).
Viewing Performance Indices
The Performance Indices page displays various indices, such as User Sessions, Tuxedo Request Queued, PMUs in Past Hour, Alarms in Past Hour, Batch Jobs in Process, and Batch Jobs in Queue.
|
Field or Control |
Description |
|---|---|
|
User Sessions |
Displays the number of users who have signed onto the system within the last 12 hours and have not signed off. Shows all PMU 109s (User Session Began) that do not have an associated 108 PMU (User Session Ended). These PMUs are associated by the session ID (Context 1). The User Sessions value includes only users who have signed on in the last 12 hours and only those users that have signed on since the last time the web server agent sent an Event 901 (Agent Initialization). For details on individual users, click the Current User Sessions link. Note: If users do not click the Sign out link on a PeopleSoft page and instead close the browser or navigate to another site, then the system displays them as current users until the web-server time-out value is reached. |
|
Tuxedo Request Queued |
Displays the number of requests queued on all application servers on the monitored system. The value is the sum of all the metric 5s (Total pq) for Event 300s (Host Resource Status) that are sent by all active agents for the current system that are domain monitor agents of type application server. The value includes all Event 300 data that is generated within the defined sampling interval. |
|
PMUs in Past Hour |
Displays the number of PMUs that have run in the past hour. This is an indication of the load on the monitored system, the level of monitoring, and whether the monitored system agents are currently communicating with the monitor. The value is the sum of the rows that are inserted into the PSPMTRANSHIST table within the last hour. For more details, click the Open PMUs and the Completed PMUs link. |
|
Alarms in Past Hour |
Displays the number of error and warning events that were posted by the monitored system's active agents in the past hour. This is the count of all events with filter levels of error and warning inserted into the PSPMEVENTHIST table in the last hour. For more details, click the Alarm History link. |
|
Batch Jobs in Process |
Displays the number of Process Scheduler jobs that are currently running on all the Process Scheduler servers belonging to that monitored system. The value is the sum of all metric 1s for Event 350 (Master Scheduler Status). For more details, click the Master Scheduler link. Note: If a Master Scheduler is not configured for the monitored system, this value is zero. |
|
Batch Jobs in Queue |
Displays the number of Process Scheduler jobs that are currently waiting to be assigned by the Master Scheduler. The value is the sum of all metric 2s for Event 350 (Master Scheduler Status). Note: If a Master Scheduler is not configured for the monitored system, this value is zero. |
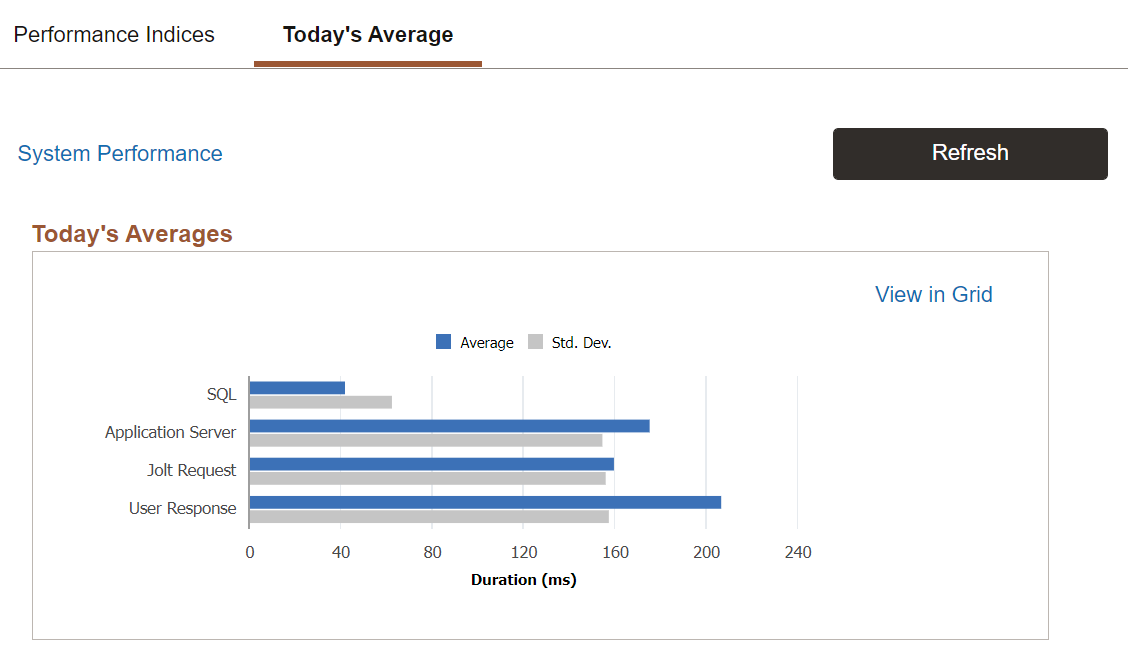
Today's Averages
The Today's Averages chart displays the average duration of various performance factors within your PeopleSoft system. The data applies only to the current day, which refers to all data that has been collected since midnight.
If progress slows in the system anywhere, this chart enables you to identify which tier is affected and enables you to monitor Tuxedo queueing.
This example illustrates the fields and controls on the Today's Averages chart. You can find definitions for the fields and controls later on this page.
|
Field or Control |
Description |
|---|---|
|
SQL |
Displays the average and standard deviation for the time spent running SQL statements that were initiated from PeopleCode in a single application server request. This value includes the time that was required for SQL Prepare, Execute, Fetch, and Commit. PeopleCode SQL statements are run by application code that is written using PeopleCode and submitted to the database by way of SQLEXECs or SQL Objects. This value is derived from metrics 2, 3, and 4 from PMU 400 (Tuxedo Service PeopleCode and SQL Summary). Namely, this value includes PeopleCode SQL, PeopleCode Built-in SQL, and PeopleTools SQL. Note: This is the average time spent for running all SQL statements of these types in a single application server request. The system calculates this value using all data that has been received since midnight. |
|
Application Server |
Displays the average and standard deviation of the duration of all PMU 400s (Tuxedo Service PeopleCode and SQL Summary) received since midnight. |
|
Jolt Request |
Displays the average and standard deviation of all PMU 115s (Jolt Request) received since midnight. |
|
User Response |
Displays the average amount of time that end users waited for server round trips to finish. A user is waiting for a server round trip to finish when Processing appears in the upper, right-hand corner of a PeopleSoft page. Note: This average does not include network latency. It is the average duration of all top-level PMU 101s (PIA Request) that the monitoring system has received since midnight. |