Viewing the Process Scheduler Dashboard
Access the Process Scheduler dashboard. (On the Health Center Summary dashboard, select Process Scheduler Dashboard.)
The Process Scheduler dashboard is similar to the Application Server dashboard. The Process Scheduler dashboard provides details of the application engine processes in addition to the domain and system information.
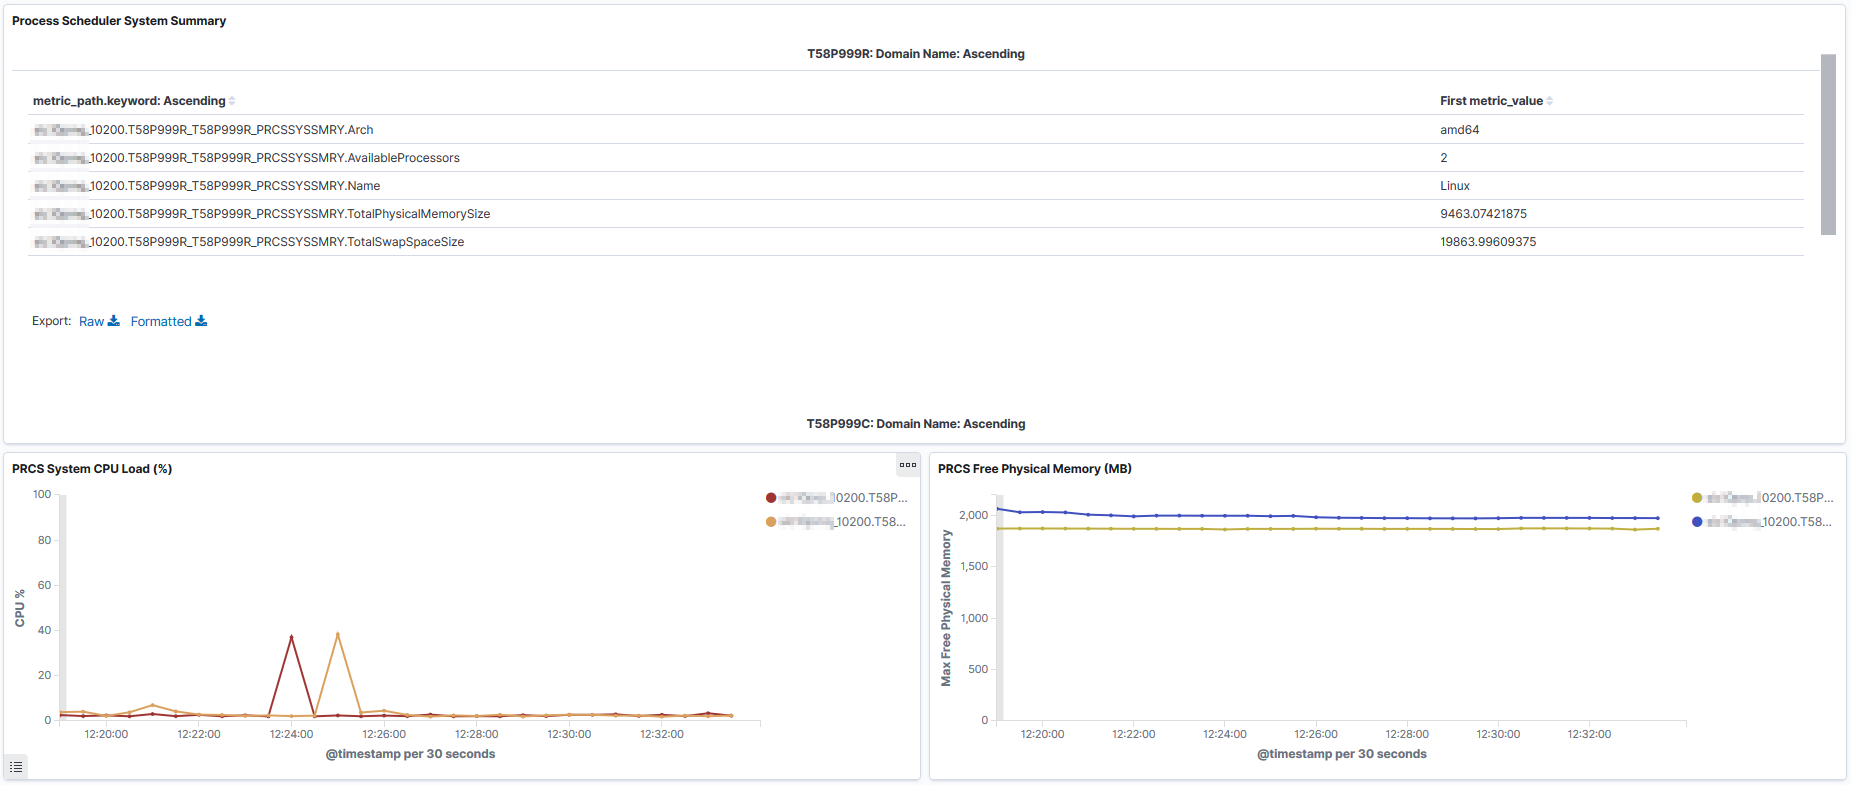
The Process Scheduler System Summary section of the dashboard provides basic information of the host machine.
This example illustrates the fields and controls on the System Summary section. You can find definitions for the fields and controls later on this page.
Field or Control |
Description |
|---|---|
Architecture |
The machine architecture. |
Available Processors |
The number of available processors on the machine. |
Name |
The operating system. |
Total Physical Memory Size |
The total amount of physical memory (in GB) available on the machine. |
Total Swap Space Size |
The total amount of swap space (in GB) available on the machine. |
PRCS System CPU Load |
A graphical visualization showing the CPU load in percentage. |
PRCS Free Physical Memory |
A graphical visualization of free physical memory size. |
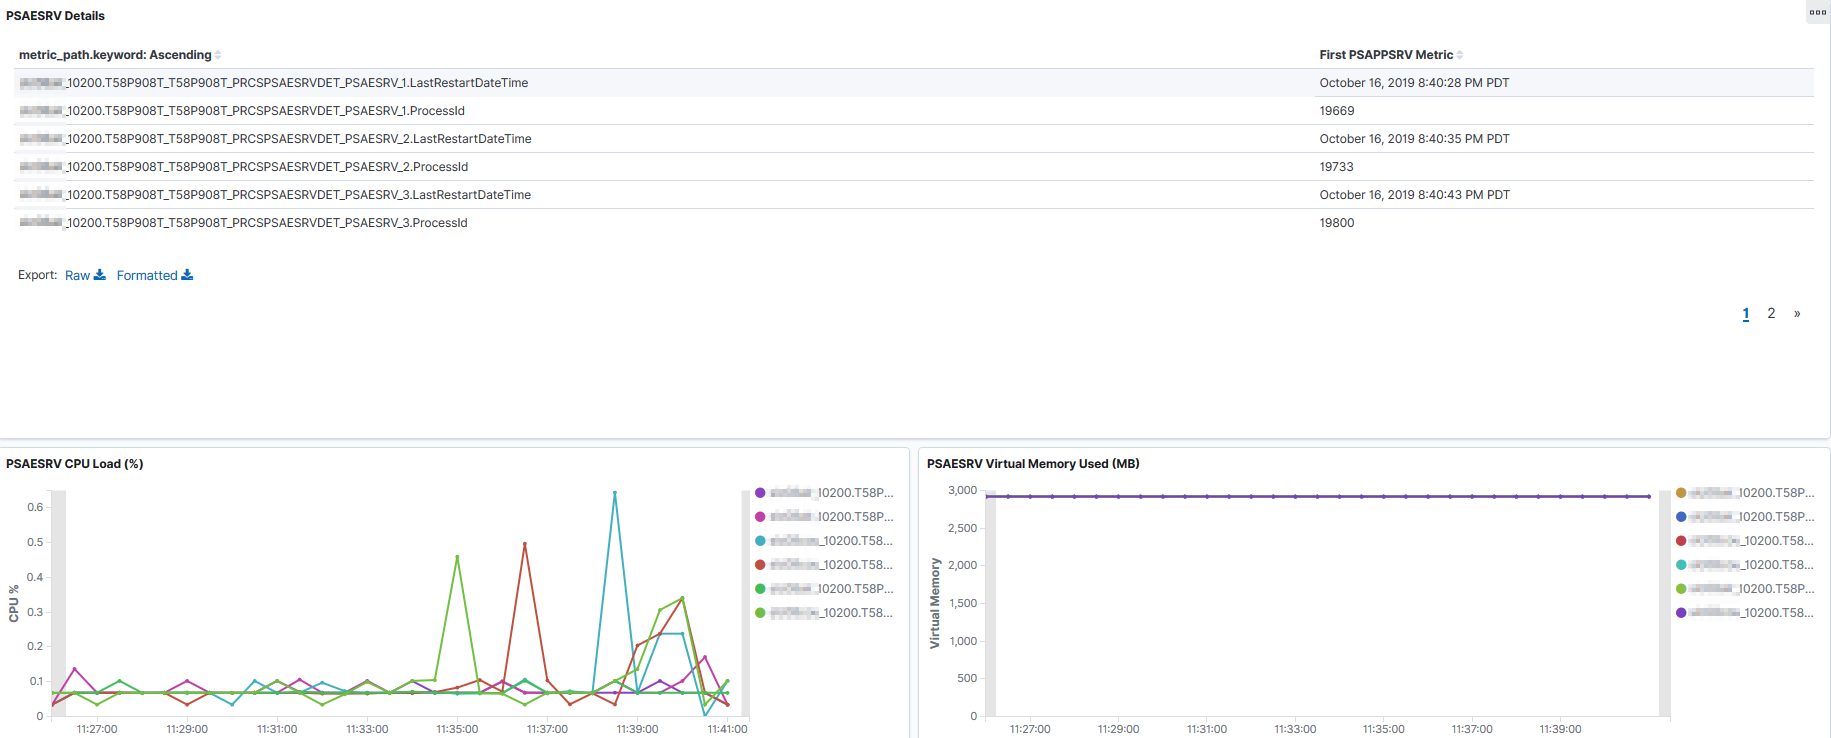
The PSAESRV Details section of the dashboard provides basic performance characteristics of the PSAESRV processes running in the domain.
This example illustrates the fields and controls on the PSAESRV Details section. You can find definitions for the fields and controls later on this page.
Field or Control |
Description |
|---|---|
PSAESRV processes |
List of PSAESRV processes currently running in the domain and provides the following details:
Note: Unlike the Application Server dashboard, you cannot drill down to the individual application engine processes. Note: If all the PSAESRV servers are consistently busy, either add more PSAESRV instances if the host is capable of handling more load, or move some jobs to another host. |
PSAESRV CPU Load (%) |
Displays the CPU utilization (in percentage) by the application engine processes. |
PSAESRV Virtual Memory Used (MB) |
Displays the virtual memory used (in MB) by the application engine processes. |
The following table lists the causes for high usage of PSAESRV CPU load and virtual memory, and their resolutions:
|
Cause |
Resolution |
|---|---|
|
Host is overloaded. |
Add more hosts to share the workload. |
|
High load due to Process Scheduler's processes. |
Monitor the jobs being processed. |
|
Specific Application Engine programs. |
Tune these programs. |
|
Server is under-powered. |
Move the Process Scheduler domain to a more powerful server. |
|
Virtual memory consumption is high for all processes. |
Check whether the Java VM Options setting in the PSMONITORSRV section in the psprcs.cfg file has a very high heap size (-Xmx). If so, lower the heap size. |
For more information, see PeopleTools Performance Guidelines Red Paper (Doc ID 747389.1), Working with Application Server Guidelines and Using PSAE and PSAESRV.