Viewing User Request Analytics
Access the User Requests page (PeopleTools, Performance Monitor, Analytics, User Request Performance).
This page shows top-level, completed PMUs that were initiated by a specific user ID. A top-level PMU is a PMU with no parent PMU. A user request is a set of PMUs that together make up a complete request to the monitored system.
Note: All rows in the User Request chart appear in ascending order by agent start date and time. Read the chart from the bottom to the top. If the date is the same between two adjacent rows, the system hides the date and shows only the time. If two rows have identical dates and times, the system adds a number (#x) to the label to differentiate the two bars. The charting tool requires the labels of the bars to be distinct.
You must enter either the user ID or the performance trace name as part of the search criteria.
Field or Control |
Description |
|---|---|
System ID |
Identifies each monitored system. System definitions are created automatically when the first agent of a monitored system registers with the monitoring system. |
Database Name |
The name of the PeopleSoft application database running on the monitored system. The monitoring system automatically inserts this value when it recognizes and creates a monitored system. |
User ID |
The user ID of the user who generated the request. The User ID field prompts against the PSPMOPRDEFN table, which is populated by the lookup program (PSPM_LOOKUP). When searching on a user ID, generally, the system attempts to match a value that is stored in the OPRID (user ID) field of the PMU history table. However, because some top-level PMUs have "_unknown_" as the OPRID, the system attempts a second match. If the top-level PMU contains "_unknown_" as the OPRID, the system searches for a PMU 113 (Authenticate) in the same PMU set (same top instance ID) where PMU 113 contains the given user in the OPRID field. |
Performance Trace Name |
You enter the performance trace name to search on PMUs within a particular performance trace. If a user has launched a performance trace in the Performance Console, the system labels every PMU that is generated in a business process with a performance trace name. Performance Trace Name prompts against the PSPMPERFTRACE table, which is populated by the lookup program (PSPM_LOOKUP). Note: When searching using a performance trace name, the search ignores all agent IDs, so the current system ID is not relevant. |
From/To Date/Time |
Specify a range of time. The system searches on the monitor date and time, not the agent date and time. If you do not specify a time range, by default, the system displays information for the current day, starting at midnight (12:00 AM). |
Static Scale |
Enables you to choose the scale of the X-axis in the User Requests chart that is generated from the search results. The search results appear in result sets, which are groups of 10. Select this option to view a static scale. Note: After you select this option, you can't clear Static Scale until you refresh the page from the browser or reenter the page. The system behavior for each type of scale is:
|
Search |
The Search button performs a search based on the search criteria that is defined on the page. If you want to view the most current information, use theRefresh button after running the initial search. If you clickSearch repeatedly, the system returns the same results from the same time range for each search. |
Refresh |
Updates the To Time value to equal the current time before performing a search. This enables you to view the most current results of a search. |
The User Requests chart reveals the time that a user initiated a specific request and its duration. The system displays user requests in sets of 10.
A single user request is represented by a bar within the bar chart. You can click any bar in the graph to view the associated User Request Detail component, which enables you to drill down into the details of a user request.
This example illustrates the fields and controls on the User Requests chart.
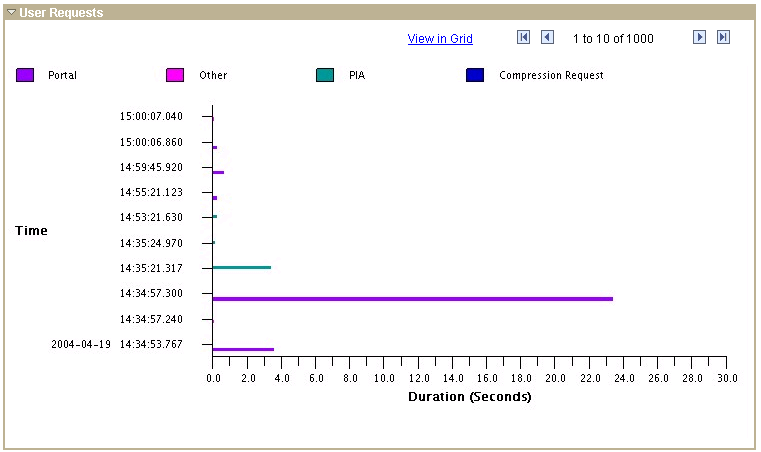
On this chart, the View in Grid hyperlink displays the chart information in a grid for downloading and customized sorting. The grid contains a hyperlink that accesses the User Request Details page.
The rows on the chart contain pop-up messages that appear when you move the cursor over the bar. The messages are:
For PMU 100 (Portal Request), the message reads Portal: [action] Duration (secs): yyy.
For PMU 101 (PIA Request), the message reads PIA: [action] Duration (secs): yyy.
For PMU 102 (Compression Request), the message reads Compression Request: [content type] Duration (secs): yyy.
All other PMUs show the PMU label followed by the duration.
See User Request Details.
The Request Time vs. Think Time pie chart reveals the ratio of the amount of time that is required for the system to process the requests in the result set against the amount of network latency and user think time. This measurement is based on the time range that you entered in the search criteria.
This chart illustrates the impact that response time has on the productivity of users in the monitored system.
The User Request Detail page appears only after you click a bar in the User Requests chart on the User Requests page. No PeopleSoft portal navigation exists for this page.
User requests are the set of PMUs that together make up a complete server round trip. All of the PMUs in a user request have the same top instance ID.
This page displays additional information for every user request that appears within the User Requests chart.
Field or Control |
Description |
|---|---|
Duration |
The duration of the top-level PMU instance for the current user request. |
Agent Start Date/Time |
The date and time that the top-level PMU began according to the clock on the monitored system. |
Monitor Received Date/Time |
The date and time that the monitoring system inserted performance information related the top-level PMU into the monitoring database. |
PMU Details |
This link accesses the completed PMU component where the system automatically loads all the PMUs with the same top PMU instance into this grid. |
Application Server Totals
Field or Control |
Description |
|---|---|
Application Server Time |
The total time spent in the application server. |
Serialization Time |
The time spent serializing data. |
Deserializtaion Time |
The time spent deserializing data. |
Total Cache Misses |
The total number of application server cache misses for this user request. Cache misses occur when the system must retrieve metadata from the database as opposed to the application server cache. This value is the sum of metric 1 from all PMU 412 (Tuxedo Service Summary PMU) rows with the same top PMU instance. Note: Continued high cache misses or file hits indicate cache problems that should be investigated. |
Total Cache File Hits |
The total number of application server cache memory hits for this user request. Cache memory hits occur when the system retrieves metadata from the application server cache file. It is the sum of metric 2 from all Tuxedo Service Summary PMU 412 (Tuxedo Service Summary) rows with the same top PMU instance. |
SQL Total Time |
The total time that is spent processing SQL for this user request. |
SQL Exec Count |
The total number of SQL statements that were run in this user request. This value is the sum of metric 6 from all PMU 400 (Tuxedo Service PCode and SQL PMU) rows with the same top PMU instance. |
SQL Fetch Count |
The total number of SQL fetches that were run in this user request. This value is the sum of metric 5 from all PMU 400 (Tuxedo Service PCode and SQL PMU) rows with the same top PMU instance. |
Global Variable Size |
The amount of memory that is used to store PeopleCode global variables. This is the sum of metric 6 from all the PMU 412 (Tuxedo Service Summary) rows with the same top PMU instance. The greater the amount of data and memory that is required for global variables, the greater the overhead that is associated with a request. |
Total Cache Memory Hits |
The metric that is associated with the PMU 412 (Tuxedo Service Summary). Cache memory hits occur when the system retrieves metadata from the application server memory, not the cache file or the database. |
Component PMUs
This section displays these PMUs that are associated with a user request:
PMU 401 (ICPanel): The ICPanel request.
Clicking the ICPanel link launches a new browser window, which contains the component statistics for that component default from midnight to the current time.
PMU 402 (Modal Level 1): The first modal level if one exists.
The first modal level is triggered by think-time PeopleCode, such as DoModal, DoCancel, and so on.
PMU 403 (Modal Level 2): The second modal level if one exists.
The second modal level contains the modal components that are called from the first modal level, such as secondary pages or lookup pages.
Field or Control |
Description |
|---|---|
PMU |
The PMU label that is defined in the PMU definition. Click this link to go to the Component Statistics page for the current component so that you can compare historical performance data for that component. |
Name |
The name of the component containing the page that is running the request. |
Page |
The name of the page running the request. |
Action |
The component action string, passed from the web server to the application server, such as Save, Search, and so on. |
Duration |
Duration of the PMU on that line in the grid. |
Component Buffer Size |
The component buffer size metric in PMU 401 (ICPanel), 402 (Modal Level 1), and 403 (Modal Level 2). The component buffer must be deserialized by the application server when it is received from the web server, and then serialized when it is sent back to the web server. The larger the buffer, the greater the impact is of serialization overhead on the monitored system. |
Queries and Scripts
This section displays the metrics of these PMUs that are associated with the user request:
PMU 410 (ICScript): metrics that are related to invoking an ICScript.
PMU 411 (ICQuery): metrics that are related to invoking an ICQuery.
Field or Control |
Description |
|---|---|
PMU |
The type of PMU: ICScript or ICQuery. |
Name |
Name of the ICScript or ICQuery. |
Action |
The action string, passed from the web server to the application server. |
Duration |
The duration of the ICScript or ICQuery. |
Tuxedo Service Information
This section displays the metrics of all PMU 400s (Tuxedo Service PCode and SQL) that are associated with the current user request.
Field or Control |
Description |
|---|---|
Duration |
Duration of PMU 400 (Tuxedo Service PCode and SQL). |
Tuxedo Service Name |
The name of the Tuxedo service that was run. |
Server Name |
The name of the server process on the application server that is running the request. |
Host/Port |
The name of the server and the JSL port. |
User Request Durations
The User Request Durations summarizes how time was spent servicing the user request. For example, it might show that the most time was spent in SQL.
Field or Control |
Description |
|---|---|
Portal Time |
The total time that was spent in the portal servlet for this request, including waits for calls to other servers. The sum of the duration of the PMU 100s (Portal Request) that are associated with the request. |
PIA Time |
The total time that was spent in the PIA servlet. It is a subset of the portal time if the PIA request originated from Portal. The sum of the duration of the PMU 100s (Portal Request) and PMU 106s (PIA Request From Portal) that are associated with the request. |
Tuxedo Service Time |
The total time that was spent in the application server. It is a subset of the PIA time for a PIA request. A large difference between the duration of the PIA bar and the Tuxedo bar indicates that the request spent time on the web server or was queued by Tuxedo. The value is equal to the sum of the duration of the PMU 400 (Tuxedo Service PCode and SQL) rows. |
PeopleCode Exec Time |
The total time that was spent by the application server running PeopleCode, including any SQL that was triggered from within the PeopleCode. It is a subset of the Tuxedo Service Time. The value is equal to the sum of metric 1 of the PMU 400 (Tuxedo Service PCode and SQL) rows that are associated with the request. |
PeopleCode SQL Time |
This is the total time that was spent by the application server running SQLExecs and SQL objects that were triggered from within the PeopleCode. It is a subset of the PeopleCode Exec Time. The value is equal to the sum of metric 2 of the PMU 400 (Tuxedo Service PCode and SQL) rows that are associated with the requests. |
PeopleCode Built-in SQL Time |
This is the total time that was spent by the application server running SQL that was triggered from within PeopleCode built-in functions such as GetNextNumber(). It is a subset of the PeopleCode Exec Time. The value is equal to the sum of metric 3 of the PMU 400s (Tuxedo Service PCode and SQL) that are associated with the requests. |
PeopleTools SQL Exec Time |
This is the total time that was spent by the application server running SQL that was triggered by the PeopleTools runtime. It is a subset of the Tuxedo Service Time. It may overlap with the PeopleCode Exec time. The value is equal to the sum of metric 4 of the PMU 400 (Tuxedo Service PCode and SQL) rows that are associated with the requests. |
Note: The number of bars appearing in the graph vary per request type.
PeopleCode Durations
This chart is a summary showing which PeopleCode event types (such as SavePreChange, SavePostChange) were triggered for this user request, how many times each type was triggered, and how much time was spent in running PeopleCode for each event type.
The PeopleCode Durations chart contains data only if a user accessed a component or ran an iScript while the filter level was set at verbose. The data is derived from PMUs 500–516.
These PMUs contain metrics for the cumulative execution count and execution time at the record field, component record, page, and component-level for each PeopleCode event type.
The number of times that a particular PMU ran appears in parenthesis.
All charts have a View in Grid hyperlink to show the chart information in a grid. This enables you to sort the information and download the information to Excel spreadsheets.