Configuring Thresholds
Use the Configure Thresholds page to configure the basic threshold settings for the grids and charts. Note that all threshold settings are applied for both classic and fluid views.
For the grids, the thresholds will appear as colored cells if the cell values are over the threshold values that you have specified.
For the charts, the values in the Reference Areas and Reference Lines fields from the sub product PeopleSoft Charting are applied.
Access the Configure Thresholds page by:
Selecting
Accessing the Specify Data Model Options page - Step 4 of the wizard.
Clicking the Define Thresholds link displayed under Define Threshold column in the Specify Axis Information grid.
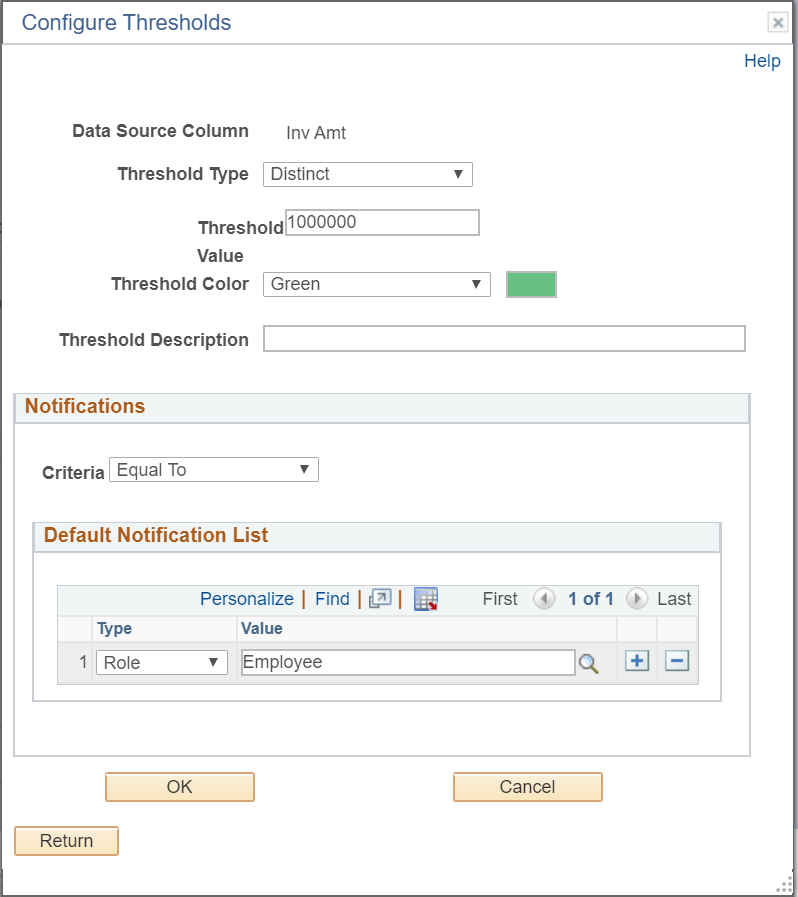
This example illustrates the fields and controls on the Configure Thresholds page. Definitions for the fields and controls appear following the example.
Field or Control |
Description |
|---|---|
Data Source Column |
Displays the name of the field for which the threshold is being defined. Note: Only fields that are set to Value can apply threshold. |
Threshold Type |
Set the threshold type. The available options are:
If the Distinct option is selected:
If the Range option is selected:
|
Threshold Value |
Specify a single threshold value. The field is available when the Threshold Type is set to Distinct. |
Lower Limit and Higher Limit |
Specify a range of minimum and maximum threshold values. These fields are available when the Threshold Type is set to Range. |
Threshold Color |
Select one color from the list of 18 available colors. The color that you select in this list will appear in the grids and the charts for the values that are above the threshold. The available colors are derived from the supported colors for PeopleSoft Charting. Note: Only one color can be specified for a threshold. |
Threshold Description |
Enter the text that will appear when you hover over the charting reference areas and lines. |
Criteria |
Set a condition to trigger a verification of a threshold violation when the condition is met. The dropdown values are displayed according to the Threshold Type.
Note: A consolidated notification for each fact is sent to users when the criteria matches. |
Default Notification List |
Select users by their user ids or roles to receive the notification. |
In addition to setting the notification conditions in the Configure Thresholds dialog box, you can opt to disable user personalization of threshold. By default pivot grid allows user personalization of threshold from the pivot grid model views of the threshold. See Display Options.
Use the Configure Threshold dialog box to configure threshold settings for individual data points on the X-axis. Note that all threshold settings are applied for both classic and fluid views.
To access the Configure Threshold dialog box:
In the Pivot Grid Viewer, select any data point on the grid or chart to display the Actions menu.
Select the Configure Threshold menu option to display the Configure Threshold dialog box.
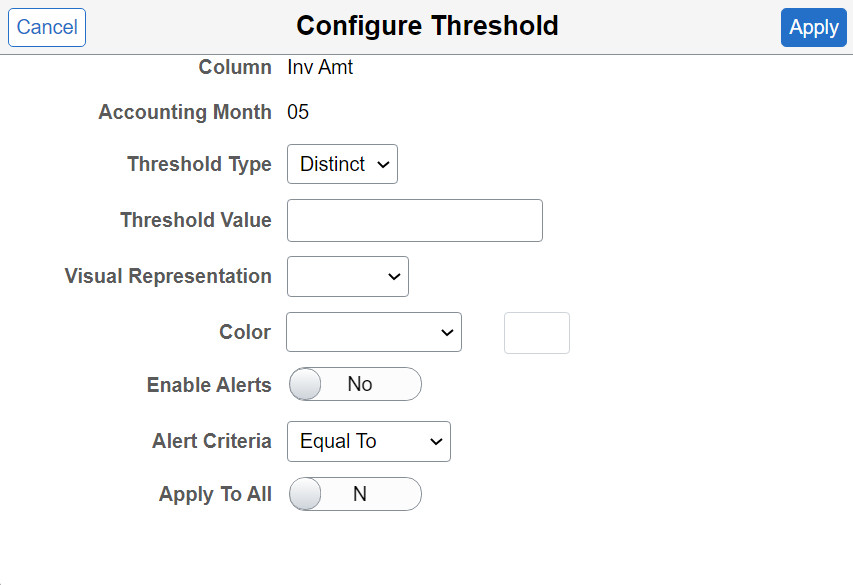
This example illustrates the fields and controls on the Configure Threshold dialog box. Definitions for the fields and controls appear following the example.
Field or Control |
Description |
|---|---|
Visual Representation |
Select the visual representation type to display the threshold in Pivot Grid Viewer:
|
Color |
Select one color from the list of 18 available colors. The color that you select in this list will appear in the grids and the charts for the values that are above the threshold. The available colors are derived from the supported colors for PeopleSoft Charting. Note: Only one color can be specified for a threshold. |
Enable Alerts |
Use this switch to enable or disable alerts. |
Alert Criteria |
Set a condition to trigger a verification of a threshold violation when the condition is met. The drop down values are displayed according to the Threshold Type.
|
Apply To All |
Set this switch to N to apply the threshold configuration to a single data point. Set this switch to Y to apply the threshold configuration to all data points on the X-axis. |
This option is available when the chart contains a dual Y-axis. You can set thresholds for a dual Y-axis from the Threshold Personalization dialog box in Pivot Grid Viewer.
Note: The behavior of the Dual Y axis feature applies to both classic and fluid views.
To access the Threshold Personalization dialog box:
In the Pivot Grid Viewer, select the Options Menu.
Select the Threshold Options menu option to display the Threshold Personalization dialog box.
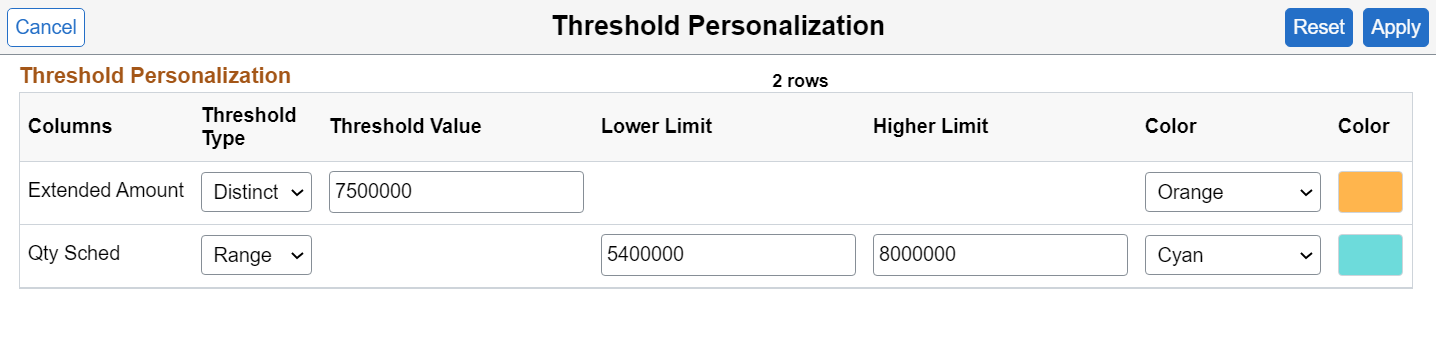
This example illustrates the fields and controls on the Threshold Personalization dialog box.
Pivot Grid administrators have to set the frequency at which notifications are sent to users. Only authorized users get the notification. For details see Configuring Notification Frequency.
Authorized users can personalize thresholds on the pivot grid model from the viewer. Opt to change threshold values of a model from the Options Menu. See Describing the Options Menu.
This example illustrates the fields and controls on the Threshold Personalization dialog box.
Field or Control |
Description |
|---|---|
Reset |
Use this button to reset the personalizations to the Pivot Grid default. |
The following sections display how thresholds appear in pivot grid views.
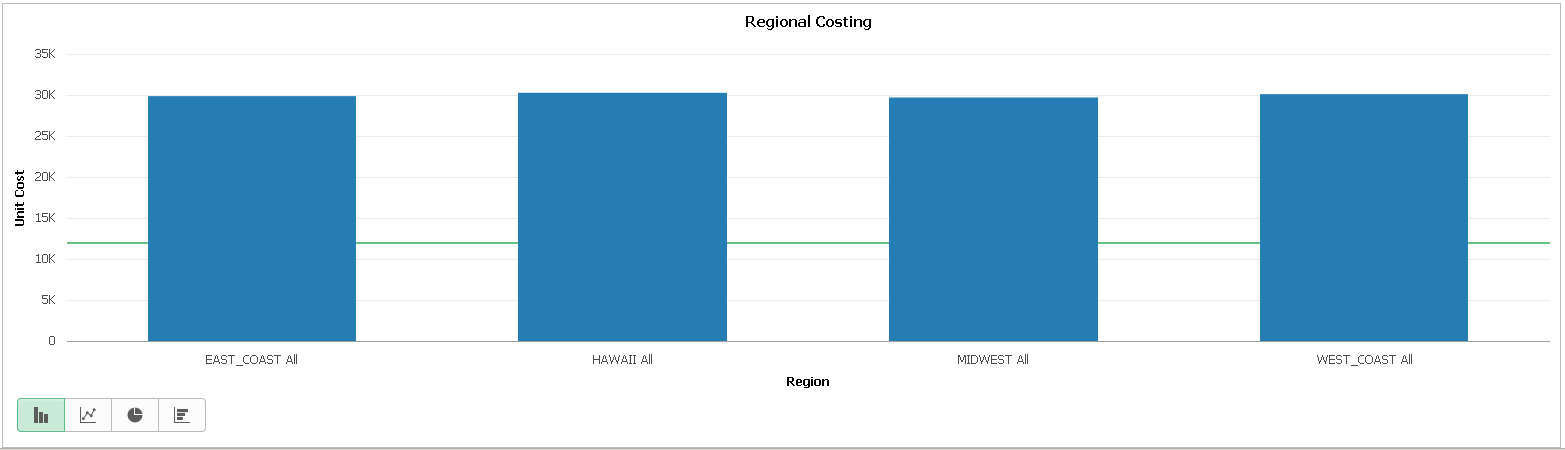
Threshold Type Distinct on Chart View
This example shows the thresholds for the Unit Cost column in a Pivot Grid chart. The threshold type is set to Distinct, the color is set to green, and the value is set to 12000.
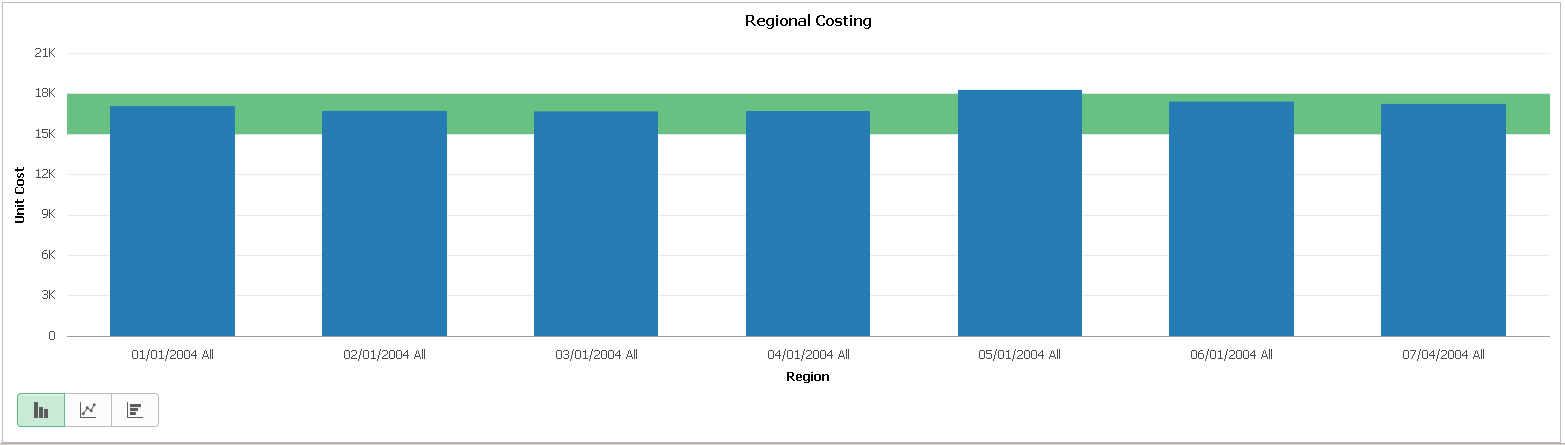
Threshold Type Range on Chart View
This example shows the thresholds for the Unit Cost column in a Pivot Grid chart. The threshold type is set to Range, the lower limit is set to 15000, the higher limit is set to 18000, and the color is set to green.
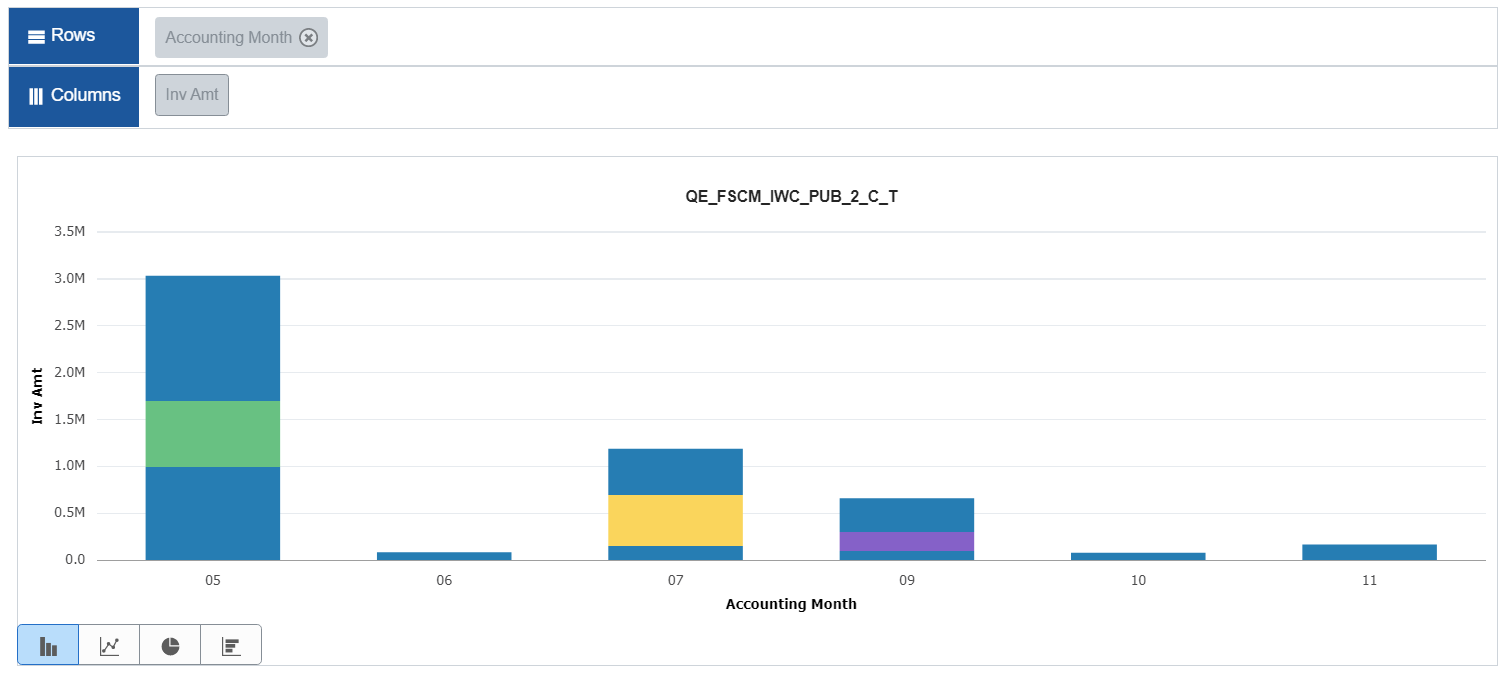
Displaying Thresholds for Individual Data Points - Block Representation
This example shows thresholds for the Inv Amt column for the months of May, July, and September in a Pivot Grid chart.
For the month of May, the threshold type is set to Range, the visual representation is set to Block, the lower limit is set to 1000000, the higher limit is set to 1700000, and the color is set to green.
For the month of July, the threshold type is set to Range, the visual representation is set to Block, the lower limit is set to 150000, the higher limit is set to 700000, and the color is set to yellow-orange.
For the month of September, the threshold type is set to Range, the visual representation is set to Block, the lower limit is set to 100000, the higher limit is set to 300000, and the color is purple.
Note: Block representation of thresholds for individual data points is only available in the Pivot Grid Viewer for Chart only views in Fluid mode.
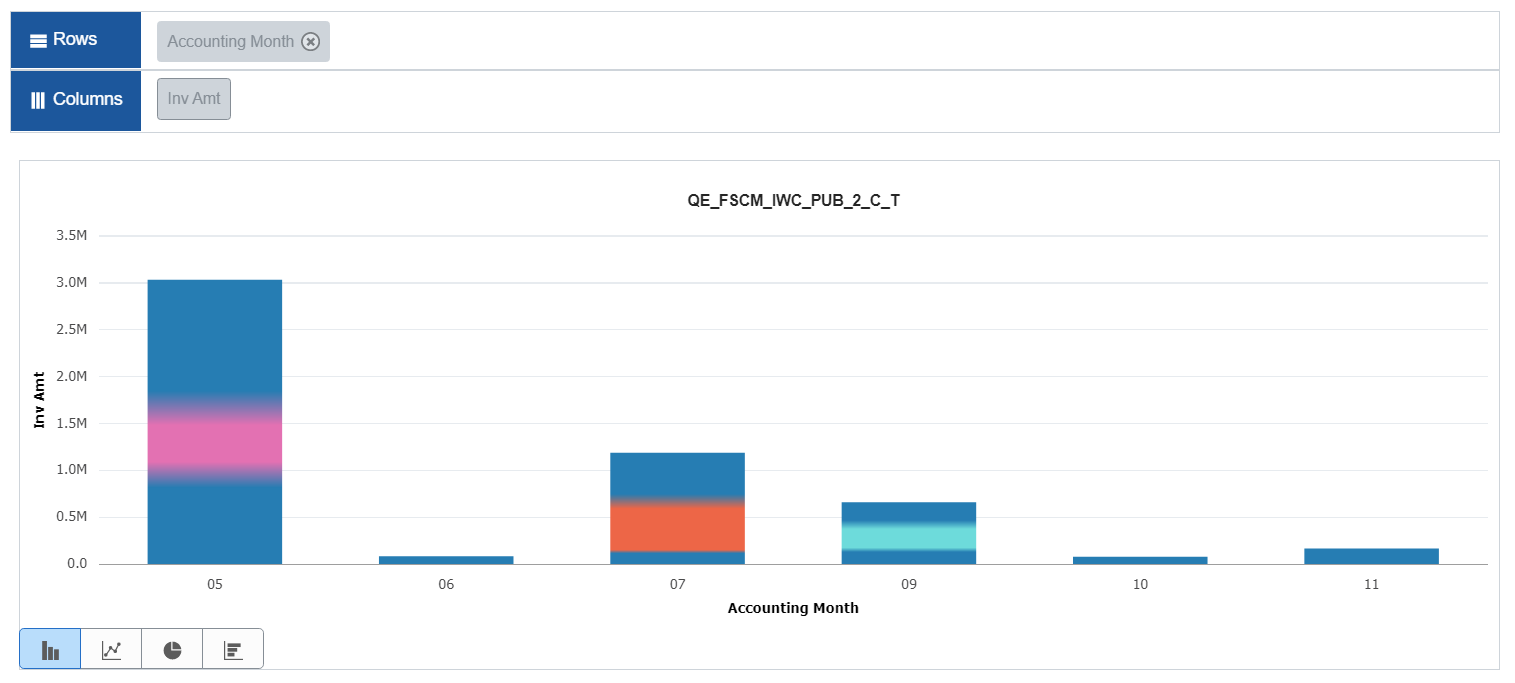
Displaying Thresholds for Individual Data Points - Gradient Representation
This example shows thresholds in gradient representation for the Inv Amt column for the months of May, July, and September in a Pivot Grid chart.
For the month of May, the threshold type is set to Range, the visual representation is set to Gradient, the lower limit is set to 1100000, the higher limit is set to 1500000, and the color is set to pink.
For the month of July, the threshold type is set to Range, the visual representation is set to Gradient, the lower limit is set to 150000, the higher limit is set to 600000, and the color is set to red.
For the month of September, the threshold type is set to Range, the visual representation is set to Gradient, the lower limit is set to 180000, the higher limit is set to 380000, and the color is cyan.
Note: Gradient representation of thresholds for individual data points is only available in the Pivot Grid Viewer for Chart only views in Fluid mode.
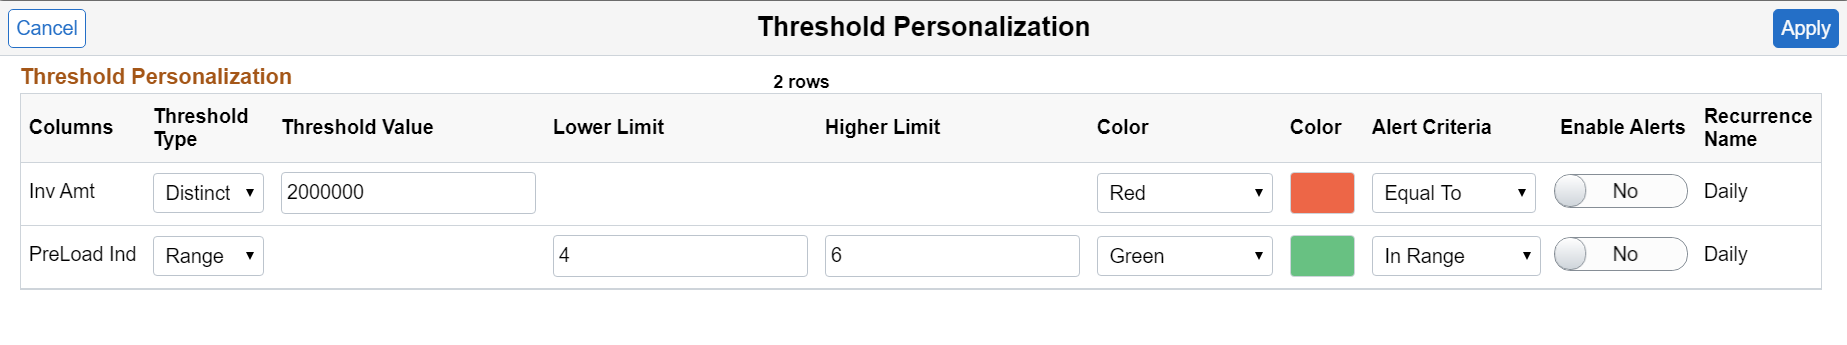
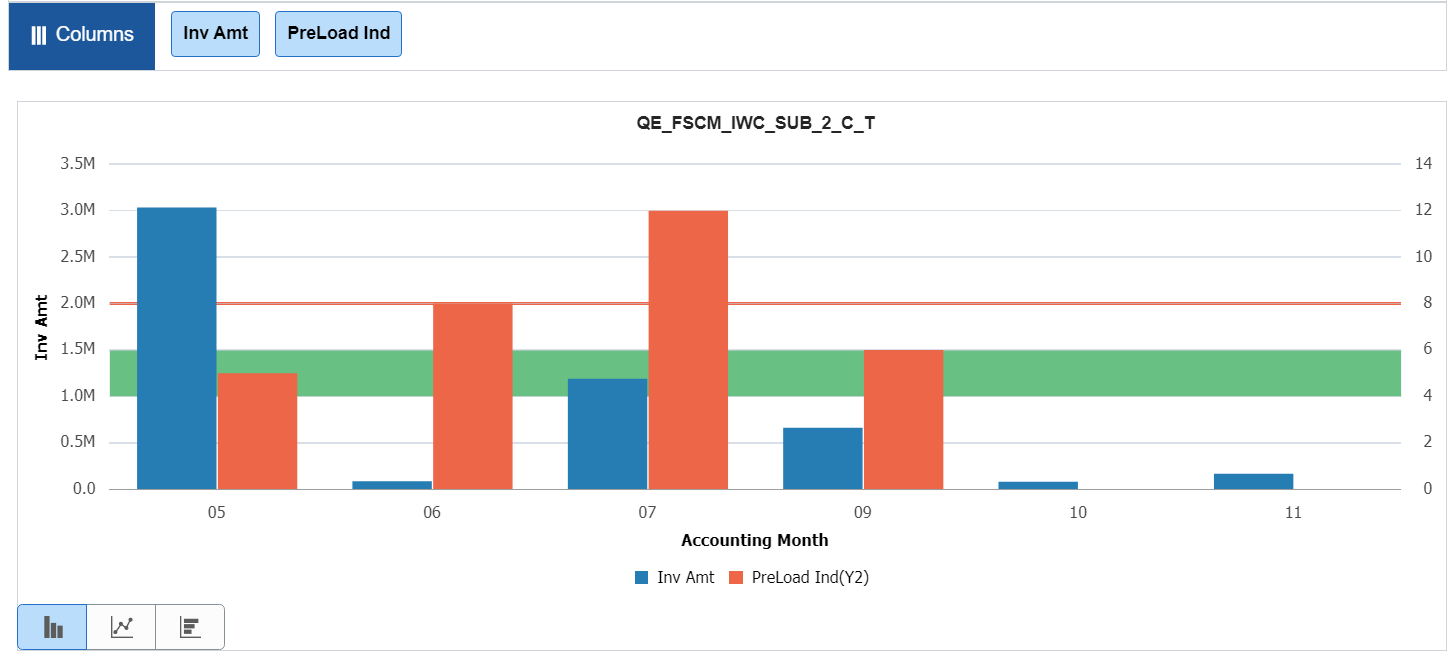
Displaying Thresholds for a Dual Y-Axis
This example shows thresholds for the Inv Amt column and the PreLoad Ind column in a Pivot Grid chart.
The threshold type for Inv Amt is set to Distinct, the threshold value is set to 2000000, and the color is set to red.
The threshold type for PreLoad Ind is set to Range. The lower limit is set to 4, the higher limit is set to 6, and the color is set to green.
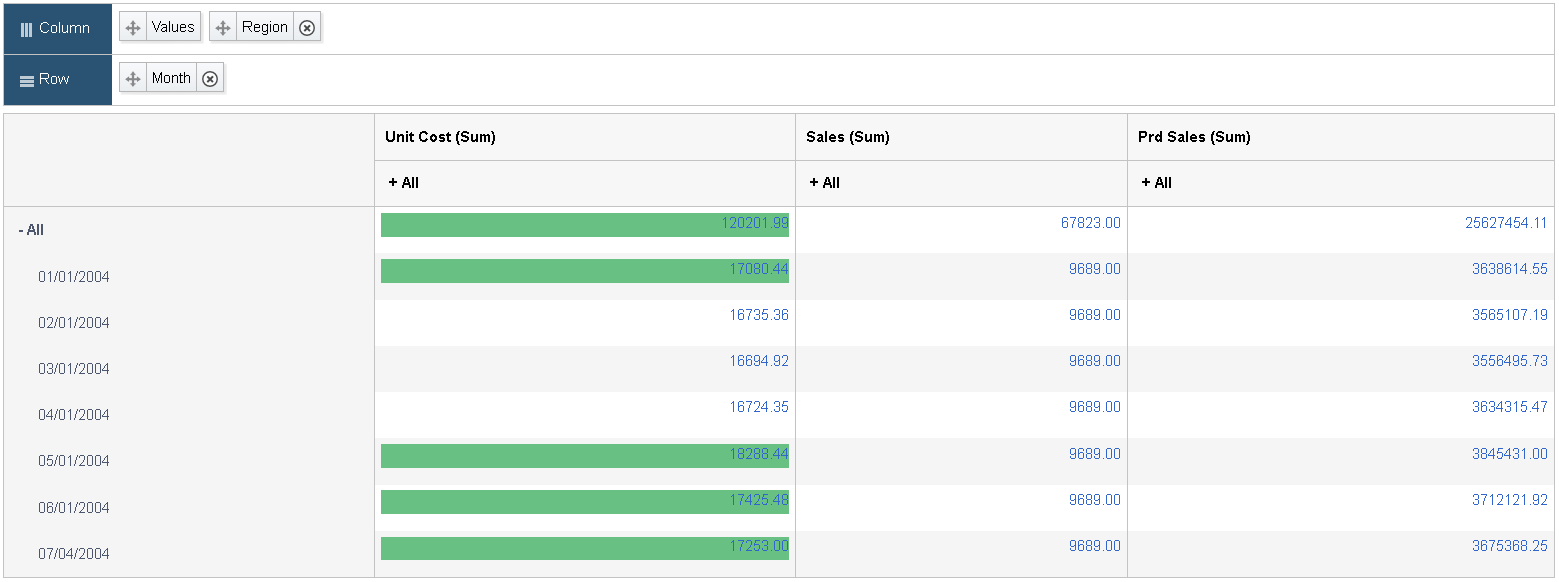
Threshold Type Set to Distinct in Grid View
This example shows the thresholds for the Unit Cost column in a pivot grid. The threshold type is set to Distinct, the value is set to 12000, and the color is set to green. Note that all the facts that are plotted on the grid can have thresholds configured.