2. Oracle FLEXCUBE Information Server
2.1 Introduction
Oracle FLEXCUBE Information system provides for flexible enterprise reporting that helps improved decision making. The Oracle FLEXCUBE Information Server collects the data stored in Oracle FLEXCUBE and generates reports.
You can use the Oracle FLEXCUBE Information Server for monitoring your business performance closely. With the reports generated using Oracle FLEXCUBE Information Server, you can have a vivid view of the problems in the business environment and identify the areas that require attention. You can also analyse the new business opportunities and trends that help you enhance your businesses.
The key features of Oracle FLEXCUBE Information Server reporting are as follows:
- Extraction of information in a consumable format at all operational levels and management hierarchies
- Cross functional data in summary form
- Provisions for totals, averages, changes, variances or ratios
- Information based on customer types and product types.
- Historical data for comparisons
2.2 Maintenances in Oracle FLEXCUBE
In order to use the Oracle FLEXCUBE Information Server, you need to maintain certain information in Oracle FLEXCUBE. These maintenances are discussed under the following headings.
2.2.1 Maintaining Batch Programs
You need to maintain the batch program ‘GEBEXTRC’ using ‘Mandatory Batch Program Maintenance’ screen. This batch extracts the data from Oracle FLEXCUBE during end of transaction input (EOTI) stage at head office. You also need to maintain the extraction routine.
After EOD operations, you need to run the batch ‘GEBEXTRC’ as intraday. During the intraday batch, the system populates the data onto FIS related tables.
2.2.2 Maintaining Details of Data Transformation Tool
You need to map the source entities (staging tables) to the respective target entities (fact and dimension tables) using ‘Data Transformation Tool’ screen. To invoke this screen, type ‘RPDDTT’ in the field at the top right corner of the application toolbar and click the adjoining arrow button.
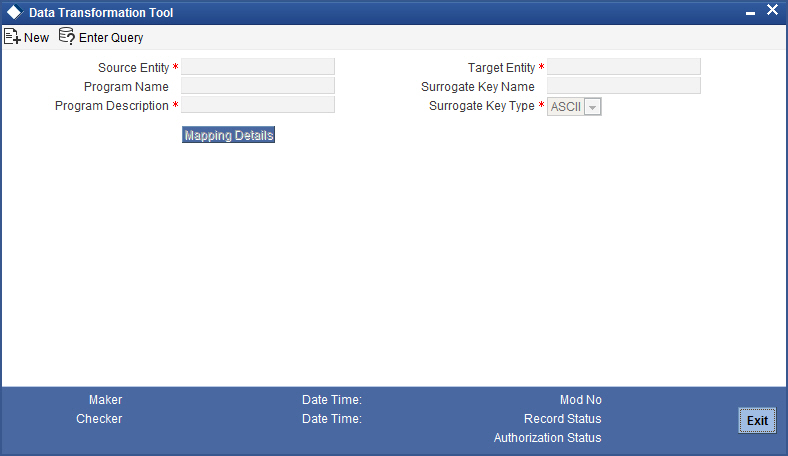
Specify the following details:
Source Entity
Select the source entity that you need to map to the target entity. The option list displays the existing staging tables available for selection. Select the appropriate one.
Target Entity
Select the target entity that you need to map to the selected source entity. The option list displays the existing fact and dimension tables available for selection. Select the appropriate one.
Program Name
Based on the target entity, the system displays the program name.
Program Description
Enter a brief description of the above program.
Surrogate Key Name
Based on the target entity, the system displays the surrogate name.
Surrogate Key Type
The surrogate key type is ASCII.
Once you have specified the above details, click ‘Mapping Details’ button to map the source and target elements. The system displays the ‘Dimension Mapping Details’ screen.
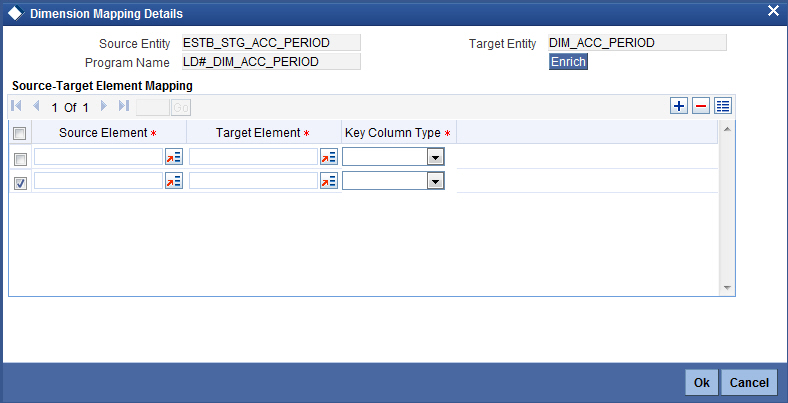
Click ‘Enrich’ button to populate the source elements. The system will populate the source elements in the screen.
You may also manually enter the source elements, In that case you need not click ‘Enrich’ button. You can directly specify the following details:
Source Element
Select the source element that you need to map to the target element.
Target Element
Select the target element to be mapped to the selected source element.
Key Column Type
Select the key column type. The drop-down list displays the following options:
- No versioning
- Natural key
- Versioning
Select the appropriate one.
You can add more rows to the list using add button. To delete a row, check the adjoining check box and click delete button.
Note
The required dimension mapping details are available within Oracle FLEXCUBE. However, if you need to modify the mapping, you can do it using these screens.
2.2.2.1 Mapping Facts
You can map the source and target elements and define the key column type and transform rules using ‘Fact Mapping Details’ screen.
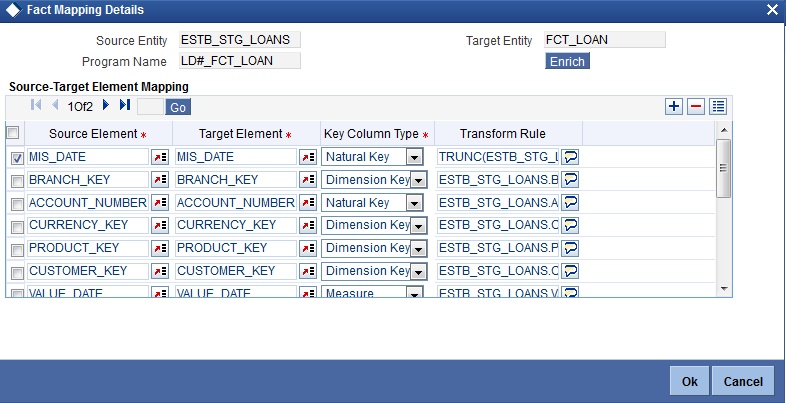
Click ‘Enrich’ button to populate the source elements.
Specify the following details:
Source Element
Select the source element that you need to map to the target element.
Target Element
Select the target element to be mapped to the selected source element.
Key Column Type
Select the key column type. The drop-down list displays the following options:
- No versioning
- Natural key
- Versioning
Select the appropriate one.
Transform Rule
Define the transform rule.
2.2.3 Maintaining FLEXCUBE Information Server Scheduler
You can maintain the Oracle FLEXCUBE Information Server jobs and their dependencies using ‘FLEXCUBE Information Server Scheduler Maintenance’ screen. To invoke this screen, type ‘RPDSCH’ in the field at the top right corner of the application toolbar and click the adjoining arrow button.
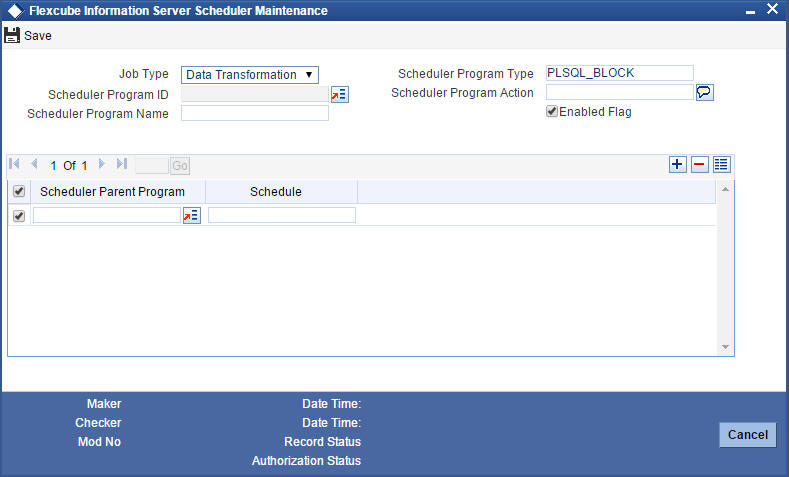
Specify the following details:
Job Type
Specify the job type ‘Data Transformation’.
Scheduler Program Type
Specify the program type. By default, the system displays ‘PLSQL_BLOCK’. However, you can modify this.
Scheduler Program ID
Select the program ID from the option list.
Scheduler Program Name
Based on the program ID, the system displays the name of the program.
Scheduler Program Action
Specify the program action.
Enable Flag
Check this box to enable the program action.
Scheduler Parent Program
Specify the scheduler parent program. You can select the appropriate program from the option list.
Schedule
Based on the selected scheduler parent program ID, the system displays the name of the schedule.
Note
The required scheduler maintenances are available in Oracle FLEXCUBE. However, if you need to modify the maintenances, you can do it using this screen.
Once you have specified the above details, save the maintenance.
2.3 Generating Reports
You can generate the various preset reports from Oracle FLEXCUBE Information Server. Login to Oracle Business Intelligence Enterprise Edition. Go to Dashboards. The reports are organized as tabs under the dashboard. You can drill down to the account level by clicking the data.
Following reports are available under the dashboards:
- New Sanctioned Limit
- Unutilized Limit
- Expired Lines Status
- Expired Line Details
- Limit Sanctioned vs Utilized
- Limit Details
- Credit Rating
- Overdrawn Lines
- Overdue Amount Recovery
- Exposure Details
- Exposure Top 10 Liabilities
2.4 Reports
The reports that you can view from the dashboard are discussed below.
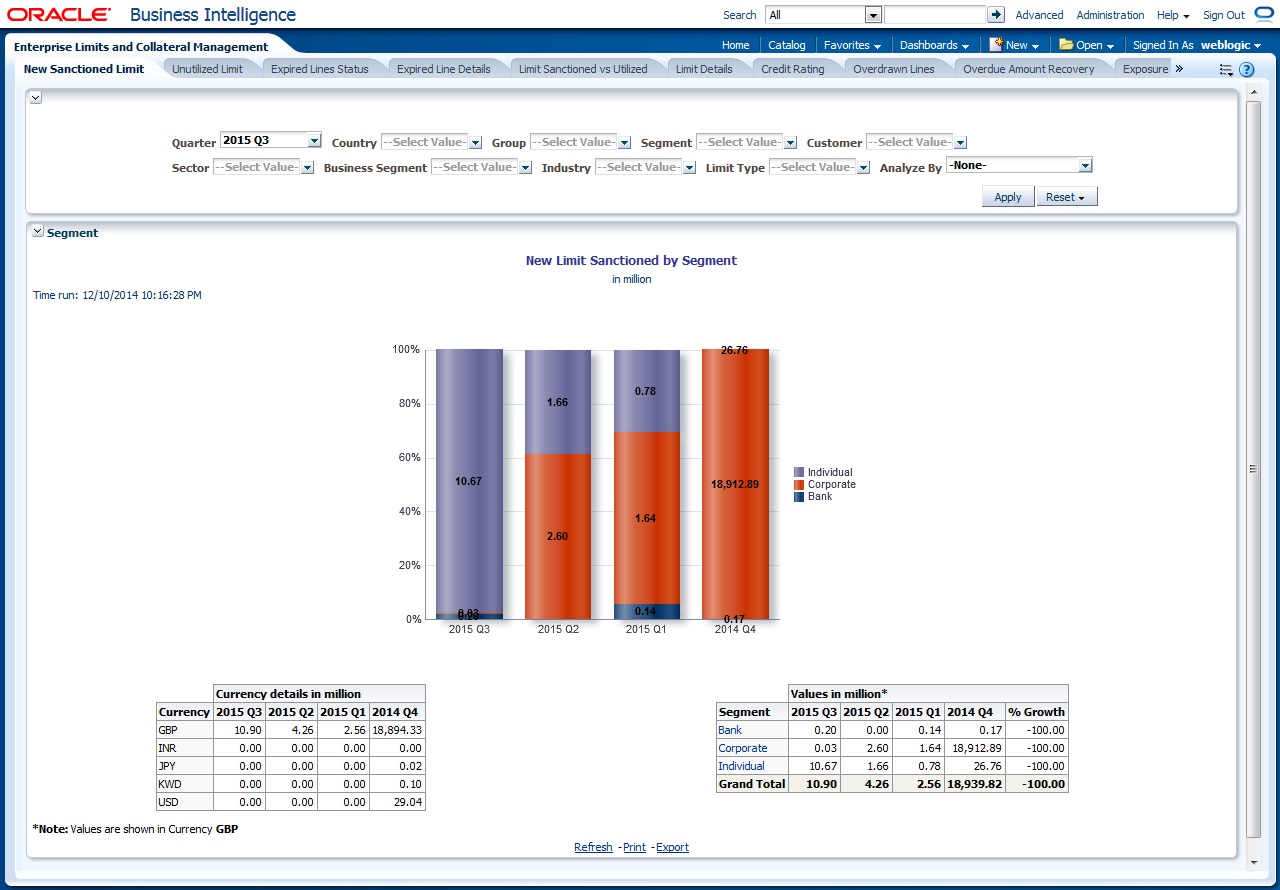
2.4.1 New Sanctioned Limit
The New Sanctioned Limit report shows the details of new limit amounts sanctioned by the bank.
Analyze By
You can analyse the report by the following parameters.
- Segment
- Country
- Business segment
- Quarter
- Sector
- Limit type
- Group
- Liab Number
- Industry
Select the appropriate dimension from the drop-down list and click ‘Apply’ button. The system displays the details of the new sanctioned limits in graph and tables, analysed based on the selected dimension.
You can also filter the reports based on the following parameters:
- Quarter
- Country
- Group
- Segment
- Customer
- Sector
- Business segment
- Industry
- Limit type
You can drill down to further levels by clicking the respective links, as illustrated below.
Analyze by Report |
Drill bown values |
Report |
Drill down values |
|
Segment |
Bank |
New Limit Sanctioned by Segment - Bank |
|
|
Corporate |
New Limit Sanctioned by Segment - Corporate |
Group Code and Unclassified |
New Limit Sanctioned by Segment Corporate - Customer |
|
Individual |
New Limit Sanctioned by Segment - Individual |
|
|
|
Country |
NA |
|
|
|
Business Segment |
List of Business Segments and Unclassified |
New Limit Sanctioned by Business Segment Secured & Unsecured |
Secured |
New Limit Sanctioned by Business Segment - Secured |
Unsecured |
New Limit Sanctioned by Business Segment - UnSecured |
|||
Quarter |
NA |
|
|
|
Sector |
List of Sectors and Unclassified |
New Limit Sanctioned by Sector - Secured & Unsecured |
|
|
Limit Type |
Secured |
New Limit Sanctioned by Type- Secured |
Utilized |
New Limit Sanctioned by Type-Secured - Utilized - Business Segment |
Unutilized |
New Limit Sanctioned by Type-Secured - UnUtilized - Business Segment |
|||
Unsecured |
New Limit Sanctioned by Type- UnSecured |
Utilized |
New Limit Sanctioned by Limit Type - Unsecured - Utilized - Business Segment |
|
|
|
|
Unutilized |
New Limit Sanctioned by Limit Type - UnSecured - Unutilized - Business Segment |
Group |
Group Codes and Unclassified |
New Limit Sanctioned by Group- Customer |
|
|
Liab No |
NA |
|
|
|
Industry |
Industries and Unclassified |
New Limit Sanctioned by Industry Secured & Unsecured |
Secured |
New Limit Sanctioned by Industry-Secured |
|
Unsecured |
New Limit Sanctioned by Industry-Unsecured |
The following actions are supported from this screen:
- Refresh - Click this link to refresh the data in the report
- Print - Click this link to print the report
- Export - Click this link to export the report in a different format
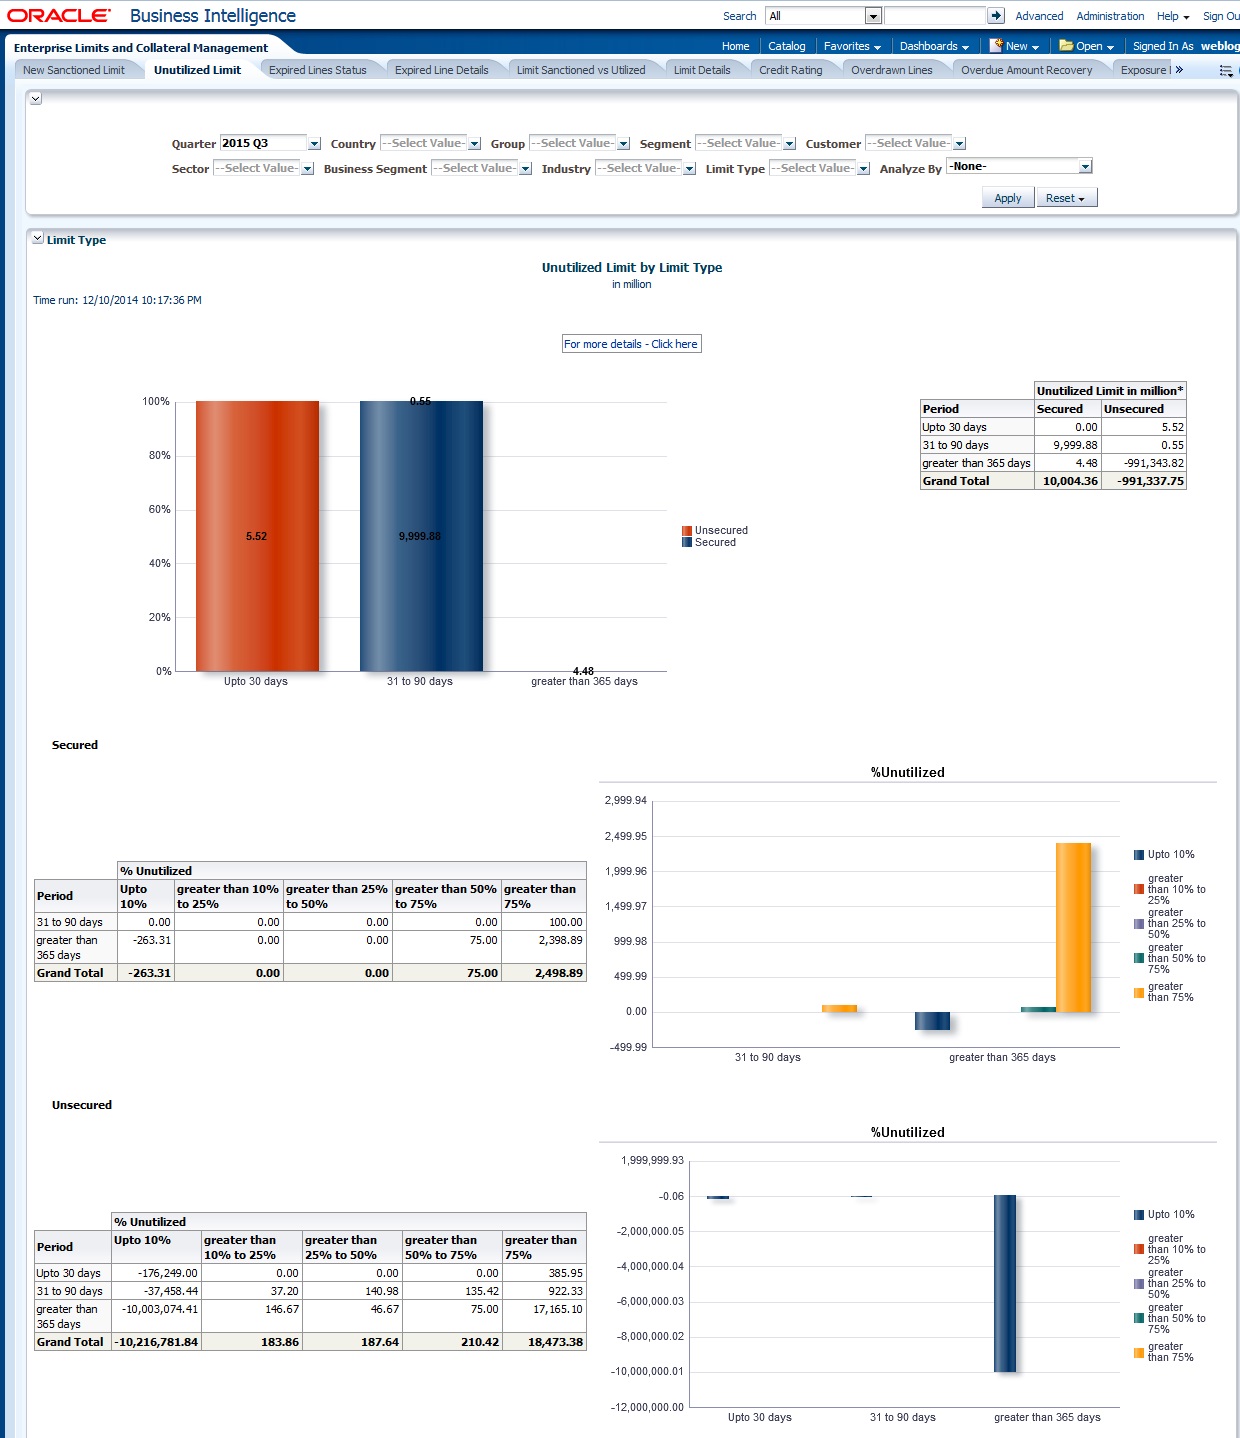
2.4.2 Unutilized Limit
The unutilized limit report shows the details of limits that are not utilised:
Analyze By
You can analyse the report by the following parameters.
- Segment
- Country
- Business segment
- Quarter
- Sector
- Limit type
- Group
- Liab Number
- Industry
Select the appropriate dimension from the drop down list and click ‘Apply’ button. The system displays the details of the unutilised limits analysed based on the selected dimension.
You can also filter the reports based on the following parameters:
- Quarter
- Country
- Group
- Segment
- Customer
- Sector
- Business segment
- Industry
- Limit type
You can drill down to further levels by clicking the respective links, as illustrated below.
Analyze By Report |
Drill Down values |
Report |
Drill Down Values |
Report |
Segment |
Bank |
Unutilized Limit by Segment - Bank |
|
|
Corporate |
Unutilized Limit by Segment - Corporate |
Group Code and Unclassified |
Unutilized Limit by Segment - Corporate - Liability No |
|
Individual |
Unutilized Limit by Segment - Individual |
|
|
|
Country |
NA |
|
|
|
Business Segment |
NA |
|
|
|
Quarter |
NA |
|
|
|
Sector |
NA |
|
|
|
Limit Type |
For More Details Click Here |
Unutilized Limit by Limit Type - Country |
|
|
Group |
NA |
|
|
|
Liab No |
NA |
|
|
|
Industry |
NA |
|
|
|
The following actions are supported from this screen:
- Refresh - Click this link to refresh the data in the report
- Print - Click this link to print the report
- Export - Click this link to export the report in a different format
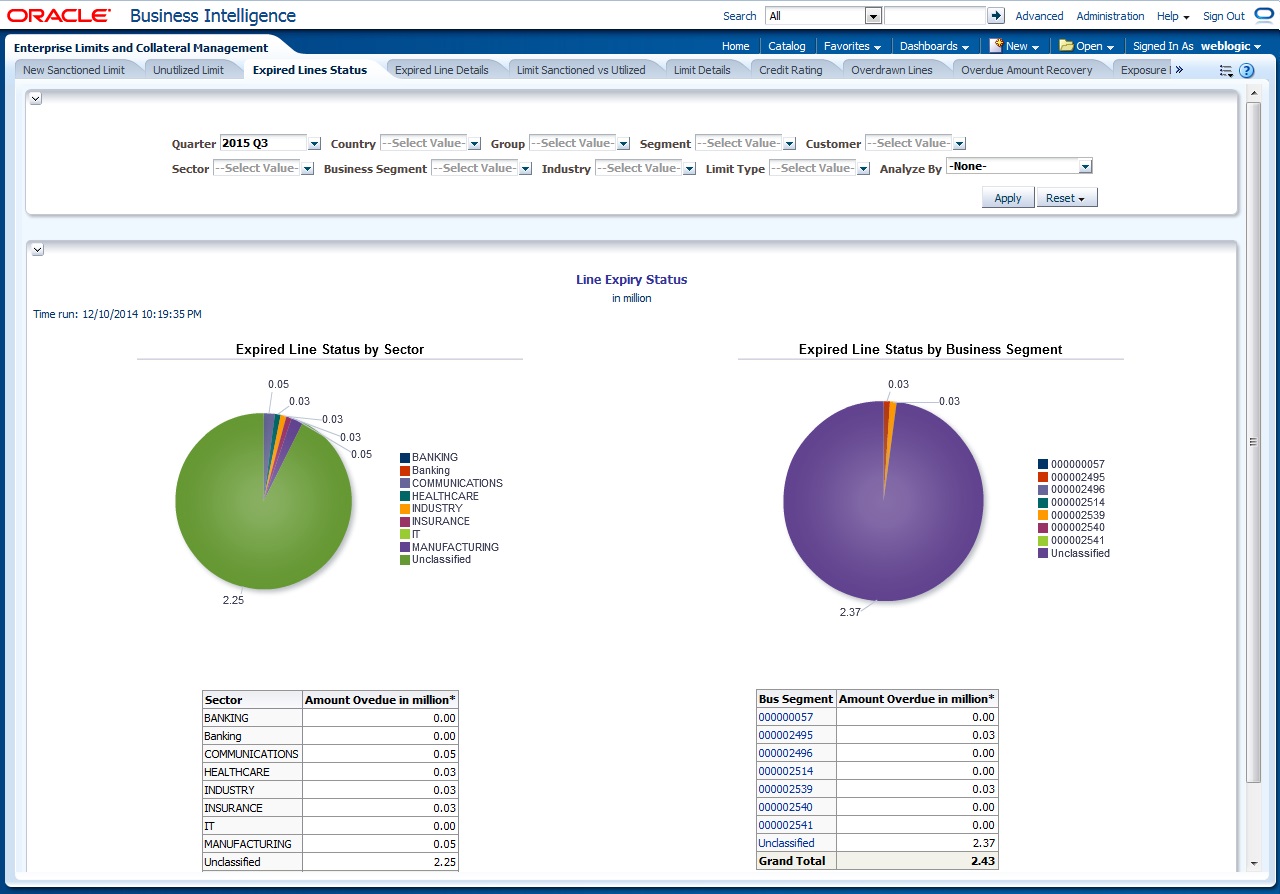
2.4.3 Expired Line Status
This report shows details of lines in expired status
Analyze By
You can analyse the report by the following parameters.
- Segment
- Country
- Business segment
- Quarter
- Sector
- Limit type
- Group
- Liab Number
- Industry
Select the appropriate dimension from the drop-down list and click ‘Apply’ button. The system displays the details of the expired lines analysed based on the selected dimension.
You can also filter the reports based on the following parameters:
- Quarter
- Country
- Group
- Segment
- Customer
- Sector
- Business segment
- Industry
- Limit type
You can drill down to further levels by clicking the respective links, as illustrated below.
Analyze By Report |
Drill Down values |
Report |
Drill Down Values |
Report |
Segment |
NA |
|
|
|
Country |
NA |
|
|
|
Business Segment |
List of Business Segments and Unclassified |
Line Expiry Status by Business Segment - Details |
For more details - Click here |
Line Expiry Status by Business Segment - Limit - Details |
Quarter |
For more details - Click here |
Line Expiry Status by Quarter Details |
|
|
Sector |
NA |
|
|
|
Limit Type |
NA |
|
|
|
Group |
NA |
|
|
|
Liab No |
NA |
|
|
|
Industry |
NA |
|
|
|
The following actions are supported from this screen:
- Refresh - Click this link to refresh the data in the report
- Print - Click this link to print the report
- Export - Click this link to export the report in a different format
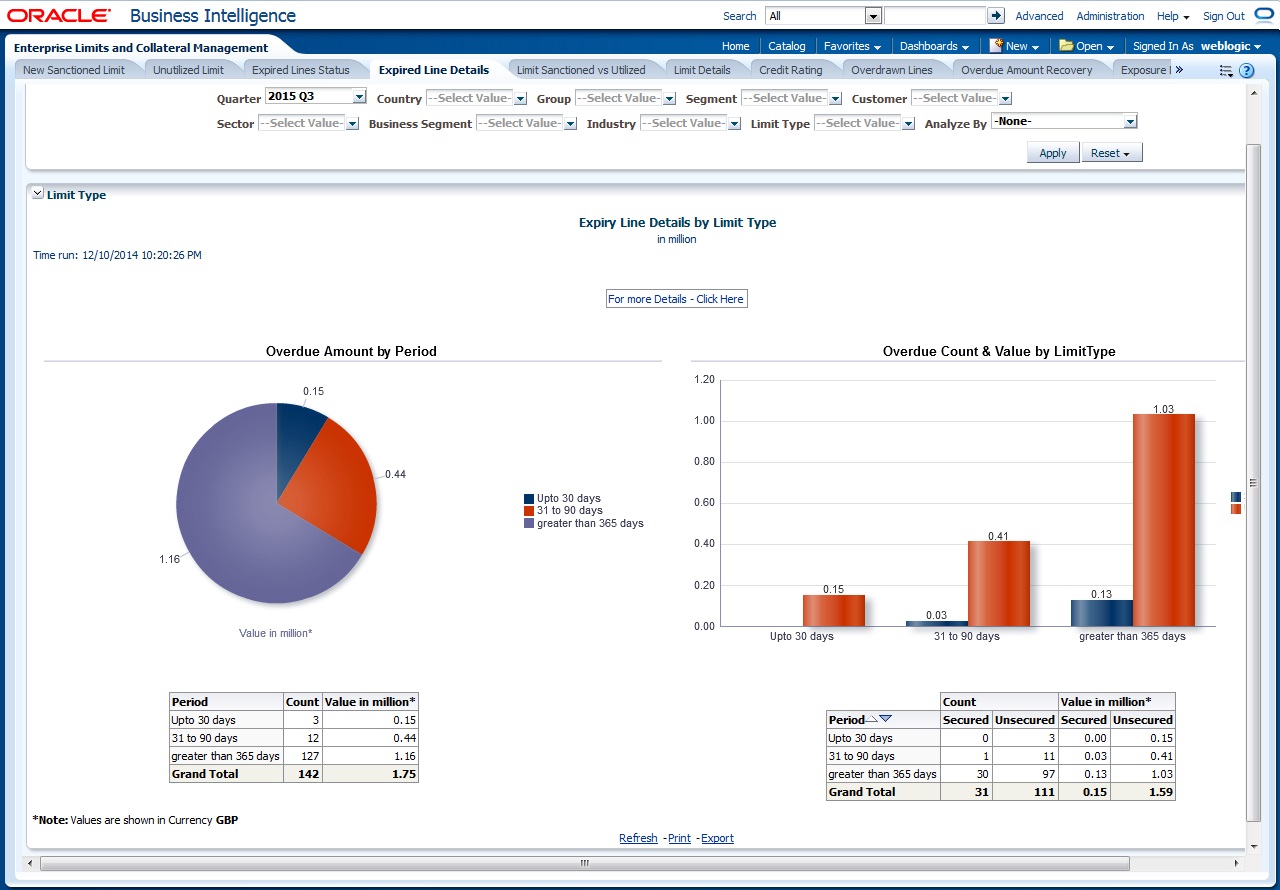
2.4.4 Expired Line Details
Expired line details report shows the details of expiry lines.
Analyze By
You can analyse the report by the following parameters.
- Segment
- Country
- Business segment
- Quarter
- Sector
- Limit type
- Group
- Liab Number
- Industry
Select the appropriate dimension from the drop down list and click ‘Apply’ button. The system displays the details of the expired lines analysed based on the selected dimension.
You can also filter the reports based on the following parameters:
- Quarter
- Country
- Group
- Segment
- Customer
- Sector
- Business segment
- Industry
- Limit type
The following actions are supported from this screen:
- Refresh - Click this link to refresh the data in the report
- Print - Click this link to print the report
- Export - Click this link to export the report in a different format. You can view the following details:
You can drill down to further levels by clicking the respective links, as illustrated below.
Analyze By Report |
Drill Down values |
Report |
Segment |
For more details - Click here |
Expiry Line Details by Period - Details |
Country |
For more details - Click here |
Expiry Line Details by Period - Details |
Business Segment |
For more details - Click here |
Expiry Line Details by Period - Details |
Quarter |
For more details - Click here |
Expiry Line Details by Period - Details |
Sector |
For more details - Click here |
Expiry Line Details by Period - Details |
Limit Type |
For more details - Click here |
Expiry Line Details by Period - Details |
Group |
For more details - Click here |
Expiry Line Details by Period - Details |
Liab No |
For more details - Click here |
Expiry Line Details by Period - Details |
Industry |
For more details - Click here |
Expiry Line Details by Period - Details |
The following actions are supported from this screen:
- Refresh - Click this link to refresh the data in the report
- Print - Click this link to print the report
- Export - Click this link to export the report in a different format
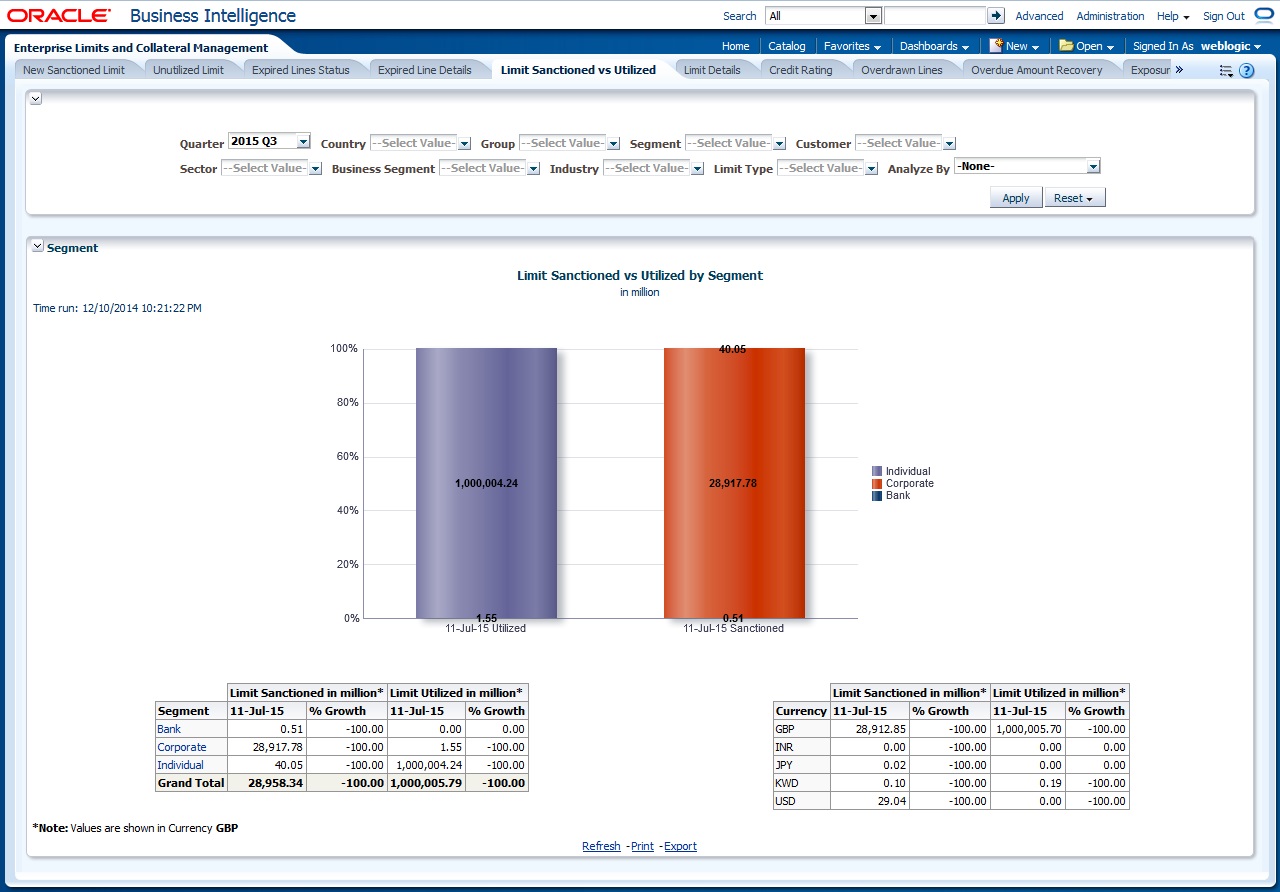
2.4.5 Limits Sanctioned Vs Utilized
This report shows the details of sanctioned limits and the utilized limits:
Analyze By
You can analyse the report by the following parameters.
- Segment
- Country
- Business segment
- Quarter
- Sector
- Limit type
- Group
- Liab Number
- Industry
Select the appropriate dimension from the drop-down list and click ‘Apply’ button. The system displays the details of the sanctioned and utilized limits based on the selected dimension.
You can also filter the reports based on the following parameters:
- Quarter
- Country
- Group
- Segment
- Customer
- Sector
- Business segment
- Industry
- Limit type
You can drill down to further levels by clicking the respective links, as illustrated below.
Analyze By Report |
Drill Down values |
Report |
Drill Down Values |
Report |
Drill Down Values |
Report |
Segment |
Bank |
Segment - Group - Details |
Group Codes and Unclassified |
Segment - Group - Customer Details |
|
|
|
Corporate |
Segment - Group - Details |
Group Codes and Unclassified |
Segment - Group - Customer Details |
|
|
|
Individual |
Segment - Group - Details |
Group Codes and Unclassified |
Segment - Group - Customer Details |
|
|
Country |
NA |
|
|
|
|
|
Business Segment |
For more details Click Here |
Business Seg wise Sanc - Utilized Details |
Liab No and Unclassified |
Business Seg wise Sanc - Utilized Details Report |
|
|
Quarter |
NA |
|
|
|
|
|
Sector |
For more Sanctioned details Click here |
Sector - Sanctioned Limit - Type Details |
List of Sectors and Unclassified |
Sector - Sanctioned Limit - Group - Details |
List of Groups and Unclassified |
Sector - Sanc Limit - Top20 & Others Cust Details |
|
For more Utilization details Click here |
Sector - Utilized Limit - Type Details |
List of Sectors and Unclassified |
Sector - Utilized Limit - Group - Details |
List of Groups and Unclassified |
Sector - Util Limit - Top20 & Others Cust Details |
Limit Type |
NA |
|
|
|
|
|
Group |
Group Codes and Unclassified |
Group - Liability No Details |
|
|
|
|
Liab No |
NA |
|
|
|
|
|
Industry |
For more Sanctioned details Click here |
Industry - Sanctioned Limit - Type - Details |
List of Industries and Unclassified |
Industry - Sanctioned Limit - Group - Details |
List of Groups and Unclassified |
Industry - Sanc Limit - Top20 & Others Cust Details |
|
For more Utilization details Click here |
Industry - Utilized Limit - Type - Details |
List of Industries and Unclassified |
Industry - Utilized Limit - Group - Details |
List of Groups and Unclassified |
Industry - Util Limit - Top20 & Others Cust Details |
The following actions are supported from this screen:
- Refresh - Click this link to refresh the data in the report
- Print - Click this link to print the report
- Export - Click this link to export the report in a different format
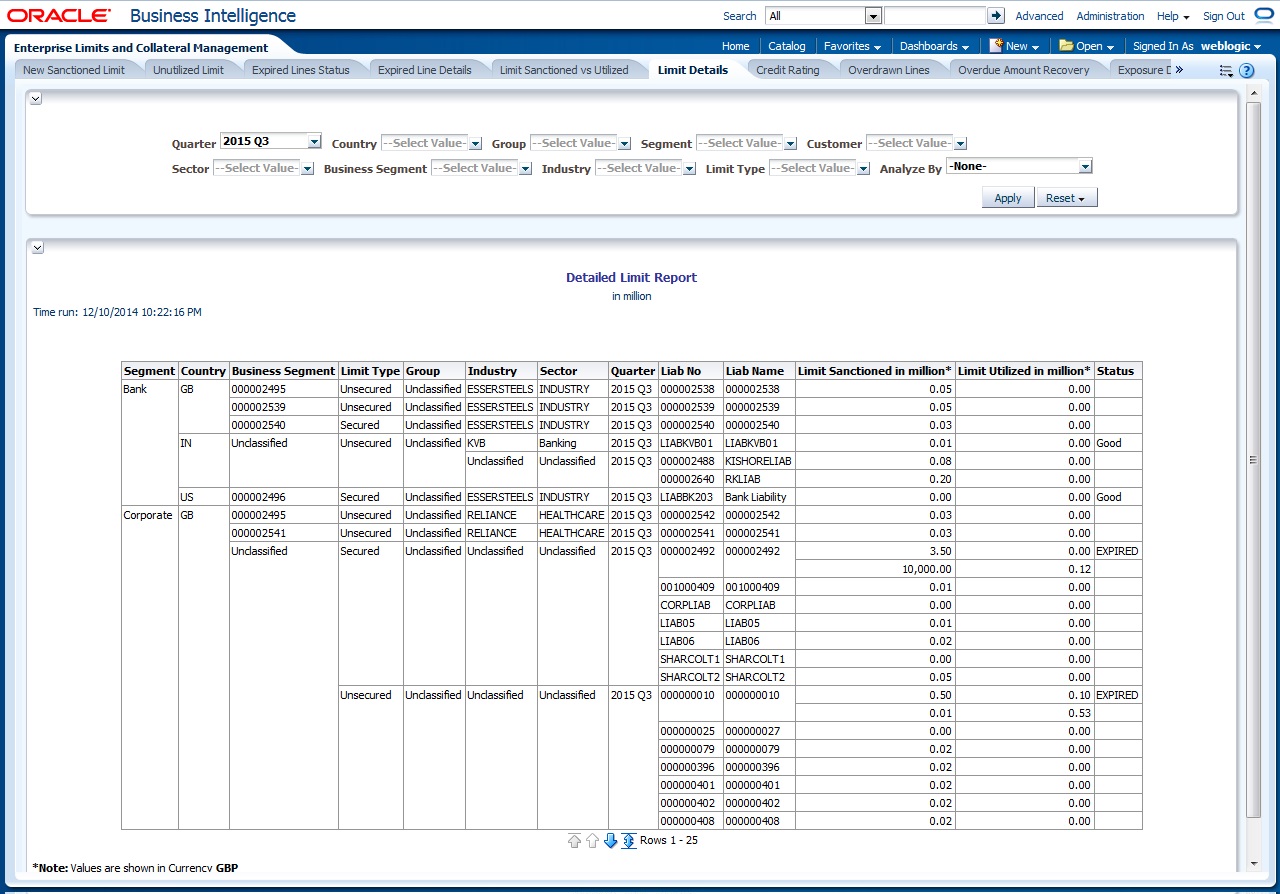
2.4.6 Limit Details
Limit details report shows the details of limits maintained in the system. This report is displayed in table format.
Analyze By
You can analyse the report by the following parameters.
- Segment
- Country
- Business segment
- Quarter
- Sector
- Limit type
- Group
- Liab Number
- Industry
Select the appropriate dimension from the drop down list and click ‘Apply’ button. The system displays the details of limits based on the selected dimension.
You can also filter the reports based on the following parameters:
- Quarter
- Country
- Group
- Segment
- Customer
- Sector
- Business segment
- Industry
- Limit type
The following actions are supported from this screen:
- Refresh - Click this link to refresh the data in the report
- Print - Click this link to print the report
- Export - Click this link to export the report in a different format
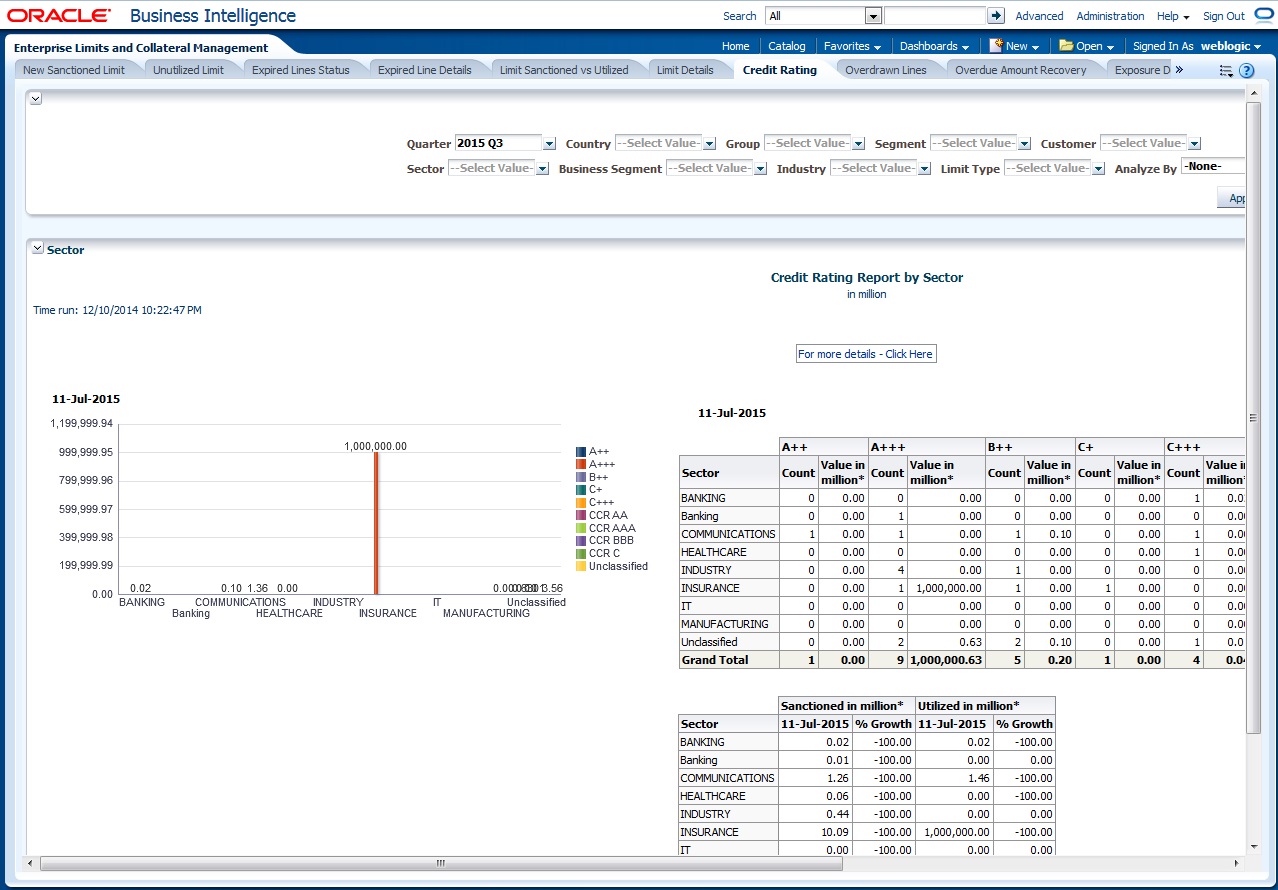
2.4.7 Credit Rating
Credit rating report shows the details of credits provided to various sectors classified based on the credit rating.
Analyze By
You can analyse the report by the following parameters.
- Segment
- Country
- Business segment
- Quarter
- Sector
- Limit type
- Group
- Liab Number
- Industry
Select the appropriate dimension from the drop down list and click ‘Apply’ button. The system displays the details of the credit ratings based on the selected dimension.
You can also filter the reports based on the following parameters:
- Quarter
- Country
- Group
- Segment
- Customer
- Sector
- Business segment
- Industry
- Limit type
You can drill down to further levels by clicking the respective links, as illustrated below.
Analyze By Report |
Drill Down values |
Report |
Segment |
For more details - Click here |
Credit Rating wise Utilization Report |
Country |
For more details - Click here |
Credit Rating wise Utilization Report |
Business Segment |
For more details - Click here |
Credit Rating wise Utilization Report |
Quarter |
For more details - Click here |
Credit Rating wise Utilization Report |
Sector |
For more details - Click here |
Credit Rating wise Utilization Report |
Limit Type |
For more details - Click here |
Credit Rating wise Utilization Report |
Group |
For more details - Click here |
Credit Rating wise Utilization Report |
Liab No |
For more details - Click here |
Credit Rating wise Utilization Report |
Industry |
For more details - Click here |
Credit Rating wise Utilization Report |
The following actions are supported from this screen:
- Refresh - Click this link to refresh the data in the report
- Print - Click this link to print the report
- Export - Click this link to export the report in a different format
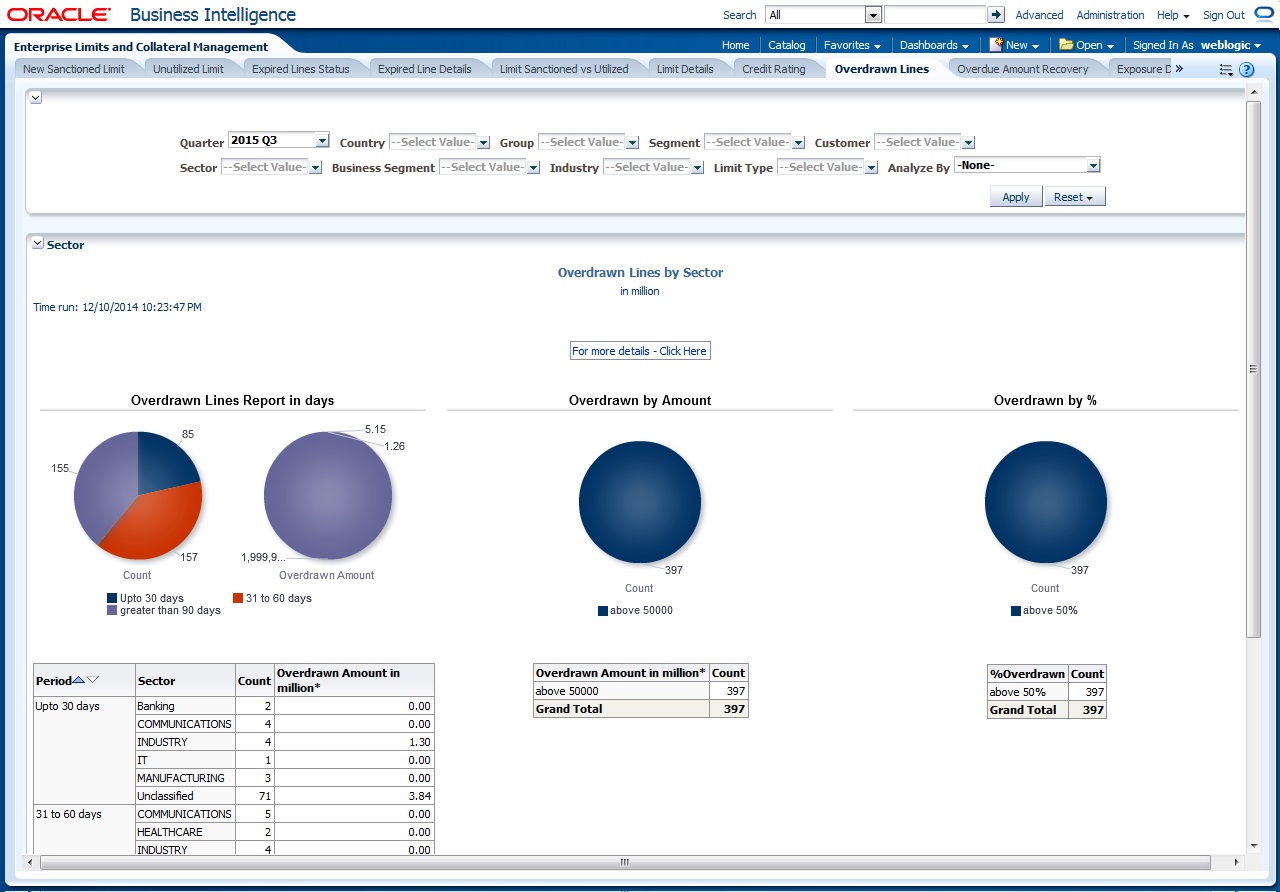
2.4.8 Overdrawn Lines
This report shows the details of overdrawn lines.
Analyze By
You can analyse the report by the following parameters.
- Segment
- Country
- Business segment
- Quarter
- Sector
- Limit type
- Group
- Liab Number
- Industry
Select the appropriate dimension from the drop down list and click ‘Apply’ button. The system displays the details of the overdrawn lines based on the selected dimension.
You can also filter the reports based on the following parameters:
- Quarter
- Country
- Group
- Segment
- Customer
- Sector
- Business segment
- Industry
- Limit type
You can drill down to further levels by clicking the respective links, as illustrated below.
Analyze By Report |
Drill Down values |
Report |
Segment |
For more details Click Here |
Overdrawn Lines Report Details |
Country |
For more details Click Here |
Overdrawn Lines Report Details |
Business Segment |
For more details Click Here |
Overdrawn Lines Report Details |
Quarter |
For more details Click Here |
Overdrawn Lines Report Details |
Sector |
For more details Click Here |
Overdrawn Lines Report Details |
Limit Type |
For more details Click Here |
Overdrawn Lines Report Details |
Group |
For more details Click Here |
Overdrawn Lines Report Details |
Liab No |
For more details Click Here |
Overdrawn Lines Report Details |
Industry |
For more details Click Here |
Overdrawn Lines Report Details |
The following actions are supported from this screen:
- Refresh - Click this link to refresh the data in the report
- Print - Click this link to print the report
- Export - Click this link to export the report in a different format
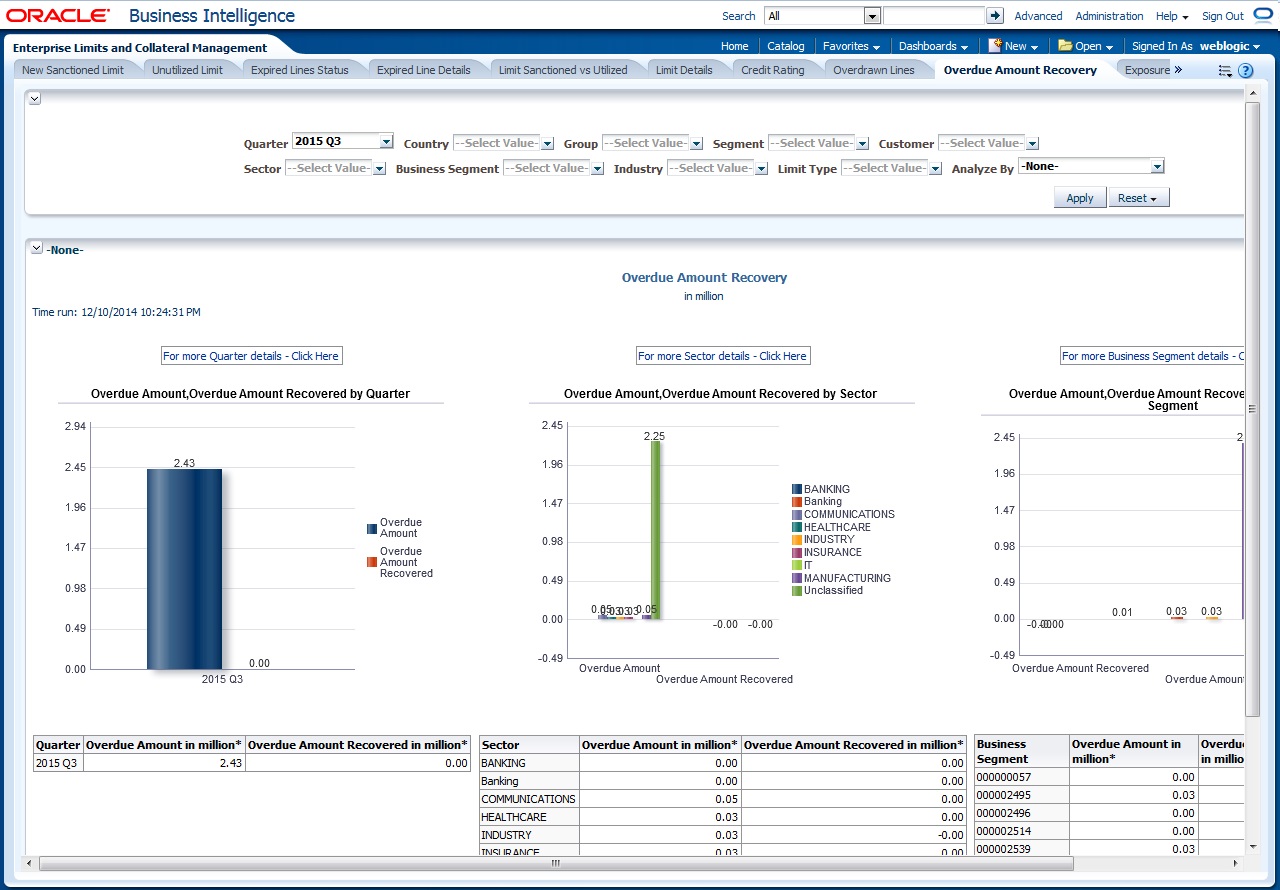
2.4.9 Overdue Amount Recovery
This report displays the details of overdue amounts and the recovery status.
Analyze By
You can analyse the report by the following parameters.
- Segment
- Country
- Business segment
- Quarter
- Sector
- Limit type
- Group
- Liab Number
- Industry
Select the appropriate dimension from the drop down list and click ‘Apply’ button. The system displays the recovery details of the overdue amount based on the selected dimension.
You can also filter the reports based on the following parameters:
- Quarter
- Country
- Group
- Segment
- Customer
- Sector
- Business segment
- Industry
- Limit type
You can drill down to further levels by clicking the respective links, as illustrated below.
Analyze By Report |
Drill Down values |
Report |
Drill Down Values |
Report |
Segment |
For more details Click Here |
Overdue Amount Recovery Details |
|
|
Country |
For more details Click Here |
Overdue Amount Recovery Details |
|
|
Business Segment |
List of Business Segments and Unclassified |
Overdue Amount Recovery by Business Segment Details |
For more details Click Here |
Overdue Amount Recovery Details |
Quarter |
List of quarters |
Overdue Amount Recovery by Quarter Details |
For more details Click Here |
Overdue Amount Recovery Details |
Sector |
List of Sectors and Unclassified |
Overdue Amount Recovery by Sector Details |
For more details Click Here |
Overdue Amount Recovery Details |
Limit Type |
For more details Click Here |
Overdue Amount Recovery Details |
|
|
Group |
For more details Click Here |
Overdue Amount Recovery Details |
|
|
Liab No |
For more details Click Here |
Overdue Amount Recovery Details |
|
|
Industry |
For more details Click Here |
Overdue Amount Recovery Details |
|
|
The following actions are supported from this screen:
- Refresh - Click this link to refresh the data in the report
- Print - Click this link to print the report
- Export - Click this link to export the report in a different format
2.4.10 Exposure Details
This report displays the details of exposure.
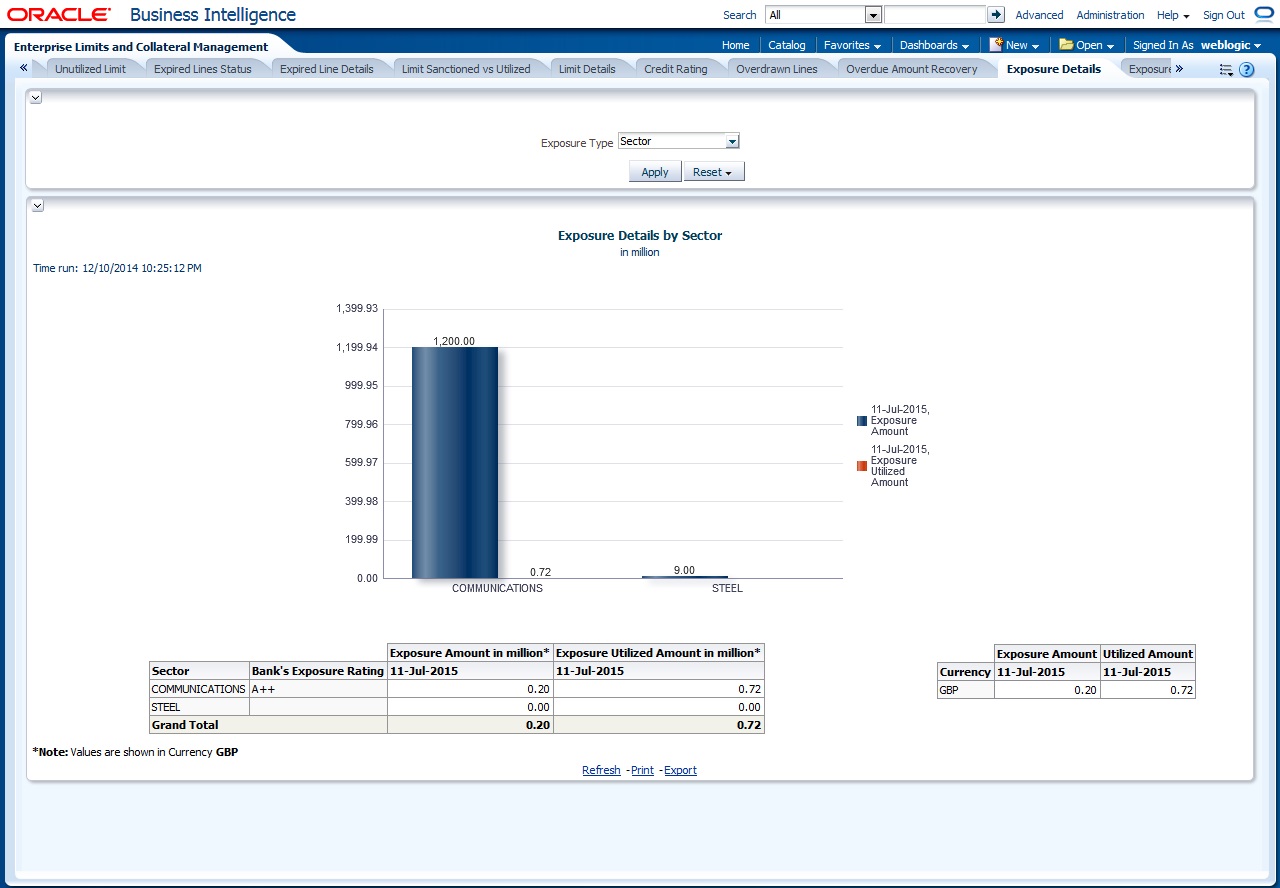
You can view this report for the following exposure types:
- Sector
- Currency
- Country
The following actions are supported from this screen:
- Refresh - Click this link to refresh the data in the report
- Print - Click this link to print the report
- Export - Click this link to export the report in a different format
2.4.11 Exposure Top 10 Liabilities
This report shows the exposure details for the top ten liabilities in the system.
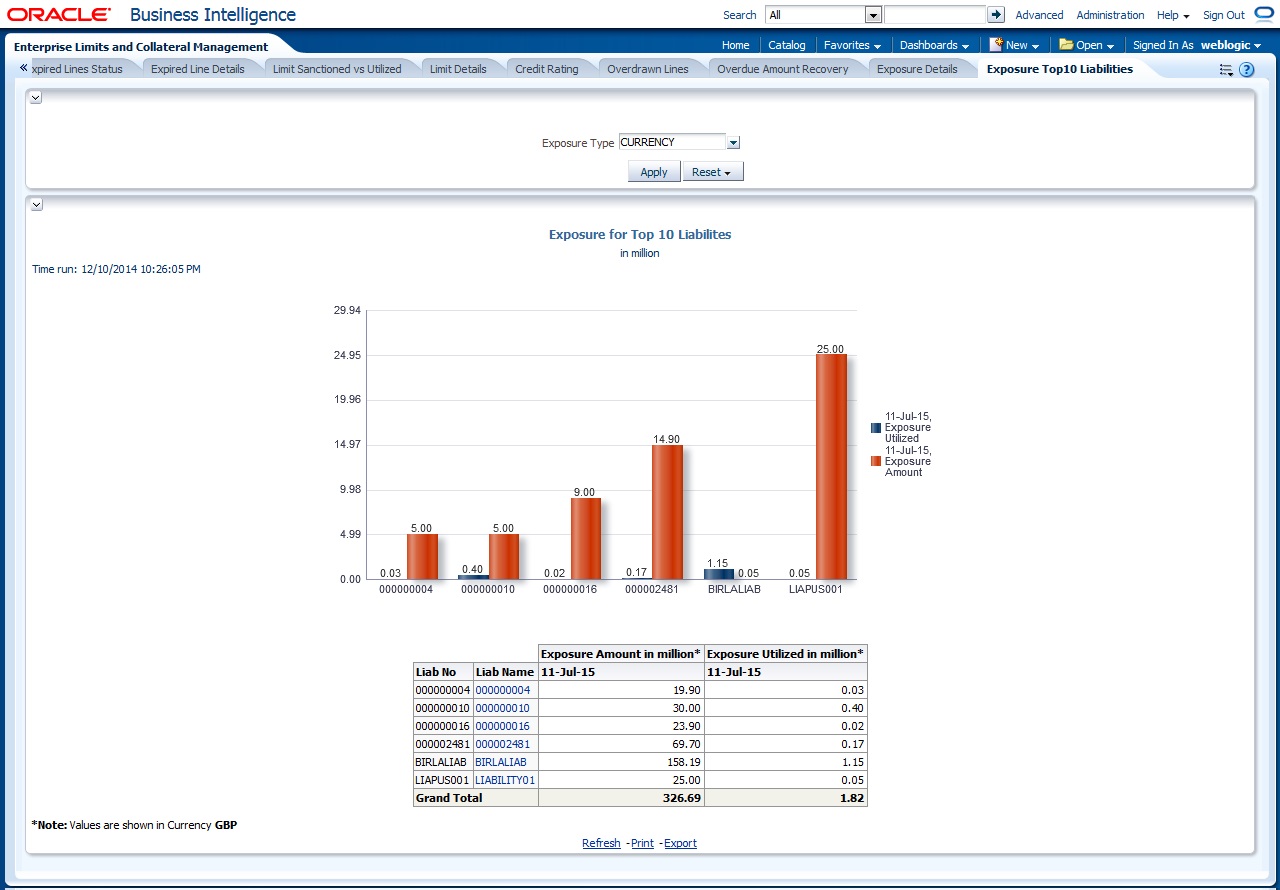
You can view this report for the following exposure types:
- Country
- Currency
- Sector
You can drill down to further levels by clicking the respective links, as illustrated below.
Analyze By Report |
Drill Down values |
Report |
Country |
Liab Name |
Exposure Top 10 Liabilites Details |
Currency |
Liab Name |
Exposure Top 10 Liabilites Details |
Sector |
Liab Name |
Exposure Top 10 Liabilites Details |
The following actions are supported from this screen:
- Refresh - Click this link to refresh the data in the report
- Print - Click this link to print the report
- Export - Click this link to export the report in a different format
2.5 Creating Dynamic Reports
You can create dynamic reports using the Oracle FLEXCUBE Information Server RPD. In order to start with creation of a dynamic report, login to OBIEE system.
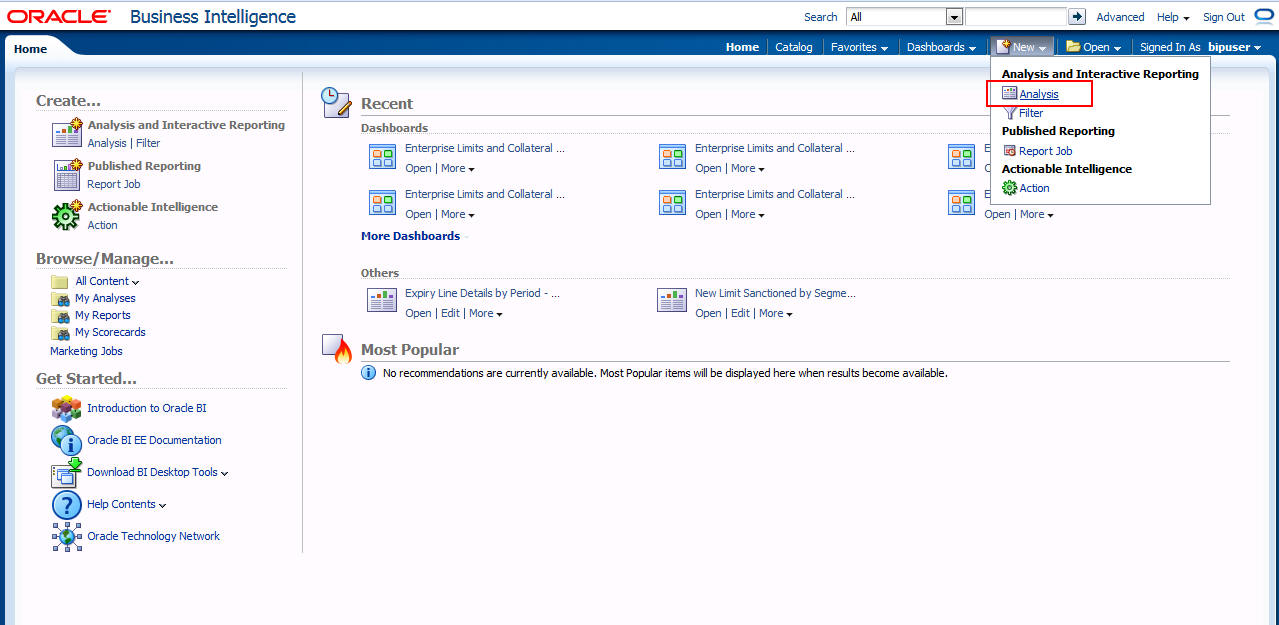
Click ‘New’ on the toolbar and select ‘Analysis’. You will be prompted to select the Subject Area.
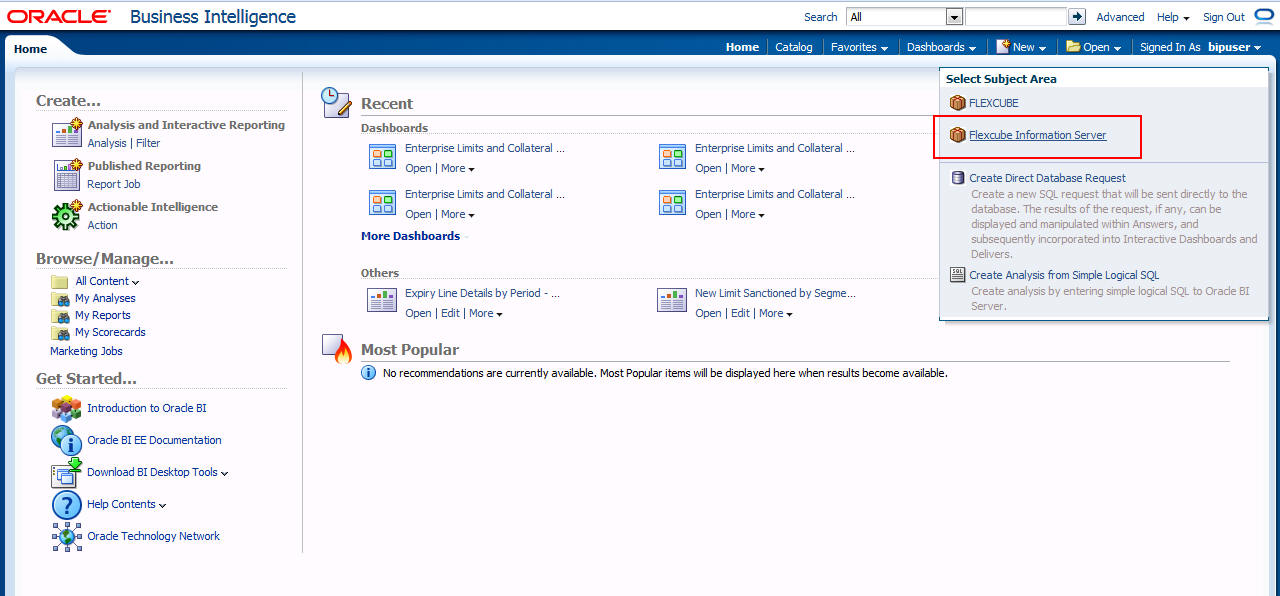
Select ‘FLEXCUBE Information Server’ from the list.
Navigate to ‘Criteria’ tab.
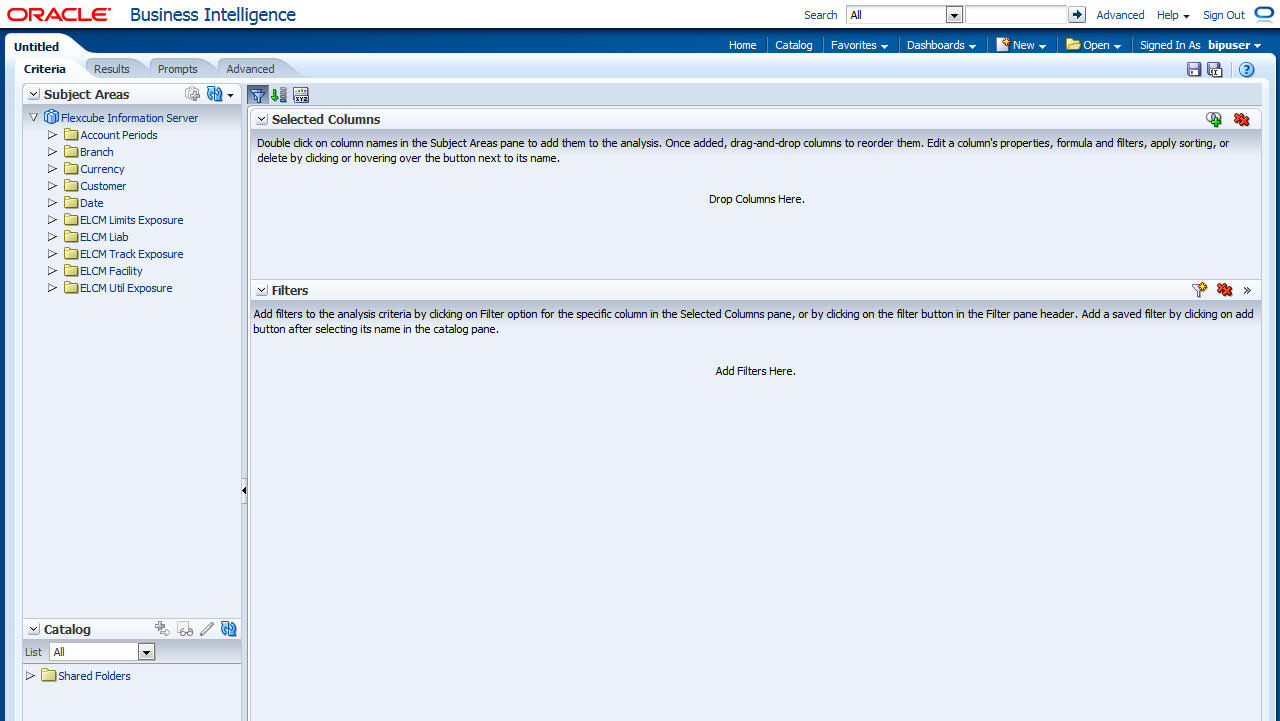
On the left pane, expand the ‘FLEXCUBE Information Server’ subject area. You can find the following folders.
Folder |
Data Type |
Description |
Account Periods |
Dimensional data |
Displays the accounting periods maintained for the bank |
Branch |
Dimensional data |
Displays all the branches maintained for the bank |
Currency |
Dimensional data |
Displays all the currencies maintained for the bank |
Customer |
Dimensional data |
Displays all the customers maintained for the bank. |
Date |
Dimensional data |
Displays all the dates from the start of accounting period to the end of accounting period |
ELCM Limits Exposure |
Dimensional Data |
Displays limits exposure details maintained for the bank |
ELCM Liab |
Dimensional Data |
Displays all the liabilities maintained for the bank |
ELCM Track Exposure |
Fact Data |
Displays tracking details for exposure maintained for the bank |
ELCM Facility |
Fact Data |
Displays facility details maintained for the bank |
ELCM Util Exposure |
Fact Data |
Displays utilization and exposure details |
The subject areas and their descriptions are available in the following table:
Folder |
Field |
Description |
Account Periods |
Period Code |
Code that identifies the period |
|
Branch Code |
Branch code |
|
Start Date |
Start date of the account period |
|
End Date |
End date of the account period |
|
Financial Cycle |
Financial cycle |
|
Year |
Year of the account period |
|
Half |
Half year of the account period |
|
Quarter |
Quarter of the year of account period |
|
Month |
Month of the period code |
Branch |
Branch Code |
Branch code |
|
Branch Name |
Name of the branch |
|
Branch Address 1 |
First line of the branch address |
|
Branch Address 2 |
Second line of the branch address |
|
Branch Address 3 |
Third line of the branch address |
|
Branch LCY |
Local currency of the branch |
|
Closure Date |
Date of closure of the branch |
|
Country Code |
Country code |
|
Parent Code |
Parent branch code |
|
Parent Name |
Parent branch name |
|
Regional Office Code |
Regional office code |
|
Regional Office Name |
Name of the regional office |
Currency |
Currency Code |
Currency code |
|
Currency Description |
Currency description |
Date |
Calendar Date |
Calendar date, all dates from the start and end of accounting periods are available |
|
Is Last Qtrday |
The last working day of the quarter |
|
Is Last Monthday |
The last working day of the month |
|
Half Year |
Denotes whether it is the first half/second half of the financial year |
|
Week Day |
Shows whether the day is a weekday/weekend |
|
Year Number |
The year of the selected calendar date |
|
Year Q Num |
The quarter of the year of the selected calendar date |
|
Quarter Name |
The name of the quarter, i.e. Q1, Q2, Q3 or Q4 |
|
Quarter Number |
The quarter number of the calendar date, i.e. 1, 2, 3 or 4 |
|
Month Name |
The name of the month |
|
Month Number |
The number that represents the month based on the financial year. Q1 will have 1, 2, 3 or 4, Q2 will have 4, 5, 6 or 7 and so on. |
|
Day Weekname |
The name of the day of the calendar date, i.e. Monday, Tuesday etc. |
|
Day Yyyymm |
The calendar date in Yyyymm format |
Customer |
Customer No |
Customer number |
|
Customer Name |
Name of the customer |
|
Short Name |
Short name of the customer |
|
Creation Date |
Date of customer creation |
|
Local Branch |
Local branch of the customer |
|
Customer type |
Type of customer |
|
Customer Status |
Status of the customer. ‘O’ indicates ‘Open’ and ‘C’ indicates ‘Closed’. |
|
Customer Category |
Category to which the customer belong |
|
Customer Classification |
Classification of the customer |
|
Customer Segment |
Segment of the customer |
|
Sex |
Gender of the customer |
|
Date of Birth |
Date of birth of the customer |
|
Deceased |
Whether the customer is deceased or not |
|
Frozen |
Whether the customer details are frozen or not |
|
Language |
Language of the customer |
|
Country |
Country to which the customer belongs |
|
Nationality |
Nationality of the customer |
|
Whereabouts Unknown |
Whether the whereabouts of the customer is known or not |
|
Address Line 1 |
First line of the customer’s address |
|
Address Line 2 |
Second line of the customer’s address |
|
Address Line 3 |
Third line of the customer’s address |
|
Address Line 4 |
Fourth line of the customer’s address |
|
Credit Rating |
Credit rating of the customer |
|
Business Segment Code |
Business Segment of the customer |
|
Industry Code |
Industry of the customer |
|
Sector Code |
Sector of the customer |
|
Group Code |
Group of the customer |
|
Exposure Country |
Country for which exposure belongs to |
ELCM Limits Exposure |
End Date |
Exposure date |
|
Exposure ID |
Exposure ID |
|
Exposure Name |
Exposure Name |
|
Exposure Rating |
Exposure Rating |
|
Exposure Type |
Exposure Type |
|
Start Date |
Start date |
|
Utilization Type |
Type of Utilization |
|
Valid Flag |
Valid flag for validation |
|
Exposure Code |
Exposure Code |
ELCM Liab |
Liab Branch |
Liability Branch Code |
|
Liab Ccy |
Liability Currency Code |
|
Liab Name |
Liability Name |
|
Liab No |
Liability Number |
|
Valid Flag |
For validation |
|
Main Liab ID |
Main Liability ID |
ELCM Track Exposure |
Exposure Currency |
Exposure Currency |
|
Exposure ID |
Exposure ID |
|
Exposure Key |
Exposure Key |
|
MIS Date |
MIS Date |
|
Available Amount FCY |
Amount Available in Foreign Currency |
|
Available Amount LCY |
Amount Available in Local Currency |
|
Exposure Amount FCY |
Exposure Amount in Foreign Currency |
|
Exposure Amount LCY |
Exposure Amount in Local Currency |
|
Utilisation FCY |
Utilisation Amount in Foreign Currency |
|
Utilisation LCY |
Utilisation Amount in Local Currency |
ELCM Facility |
Currency |
Currency Code |
|
Facility ID |
ID of each facility |
|
Limit Type |
Type of limit; Secured or unsecured |
|
Main Liab ID |
Main Liability ID |
|
Liability Number |
Liability Number |
|
Line Code |
Identifier for the line |
|
Limit Sanctioned Date |
Date on which limit is sanctioned |
|
Limit Sanctioned FCY |
Limit sanctioned in foreign currency |
|
Limit Sanctioned LCY |
Limit sanctioned in local currency |
|
Limit Utilized FCY |
Limit utilized in foreign currency |
|
Limit Utilized LCY |
Limit utilized in local currency |
|
Line Amount Recovered FCY |
Amount recovered in foreign currency |
|
Line Amount Recovered LCY |
Amount recovered in local currency |
|
Line Exp Amount FCY |
Expired amount in foreign currency |
|
Line Exp Amount LCY |
Expired amount in local currency |
|
Line Expiry Date |
Date on which line is expired |
|
Matured Util Amount |
Utilized amount matured |
|
Mis Date |
Business Date |
|
Module |
Module |
|
New Liab Qtr |
Flag for the new liability in the quarter |
|
Overdrawn Amount Fcy |
Amount overdrawn in foreign currency |
|
Overdrawn Amount LCY |
Amount overdrawn in local currency |
|
Overdrawn Date |
Date on which amount is overdrawn |
|
Recovery Date |
Date on which amount is recovered |
|
Revolving Line |
Flag to indicate that the line is Revolving |
|
Util Date |
Date on which amount is utilized |
|
Status |
Line status |
|
Unutilized Limit LCY |
Amount not utilized in local currency |
|
% Unutilized |
Percentage of unutilization |
|
Prev Recovery Amount LCY |
Amount recovered on previous date in local currency |
ELCM Util Exposure |
Available Amount FCY |
Available amount in foreign currency |
|
Available Amount LCY |
Available amount in local currency |
|
Exposure Amount FCY |
Exposure amount in foreign currency |
|
Exposure Amount LCY |
Exposure amount in foreign currency |
|
Exposure ID |
Exposure ID |
|
Utilization FCY |
Utilization in foreign currency |
|
Utilization LCY |
Utilization in local currency |
|
Exch Rate |
Exchange rate |
|
Exp Ccy |
Exposure currency |
|
Liab ID |
Liability ID |
|
Main Liab ID |
Main Liability ID |
|
Util Amt |
Utilization Amount |
|
Util Ccy |
Utilization Currency |
|
Util ID |
Utilization ID |
|
Liab Name |
Liability Name |
|
Liab No |
Liability Number |
|
Exp Util Fcy |
Liability Number |
|
Exp Util Lcy |
Exposure utilized in local currency |
|
Mis Date |
Business Date |
|
Cparty Appetite FCY |
Counterparty appetite in foreign currency |
|
Cparty Appetite LCY |
Counterparty appetite in local currency |
The subject areas that you select for a particular report decide the data that needs to be taken for generating the report. You can expand the folders mentioned above and select the columns that are required in the report.
Double-click a column name to add it to the report. The selected columns are displayed on the screen.
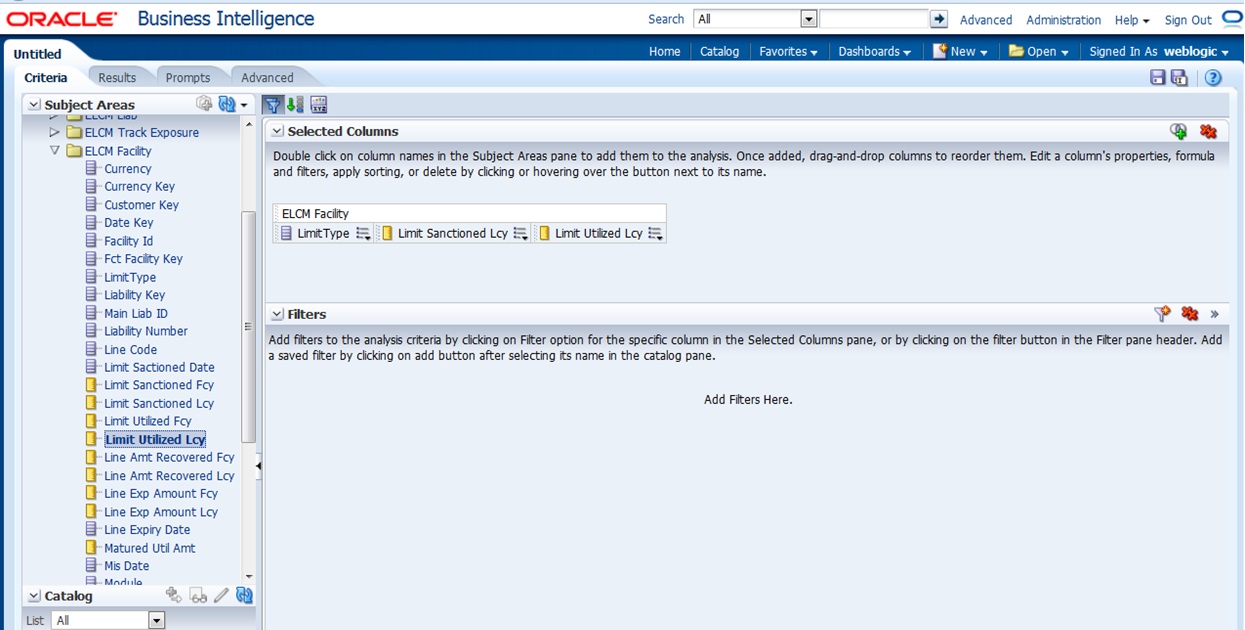
In order to add filters to the report, click the ‘Filter’ icon.
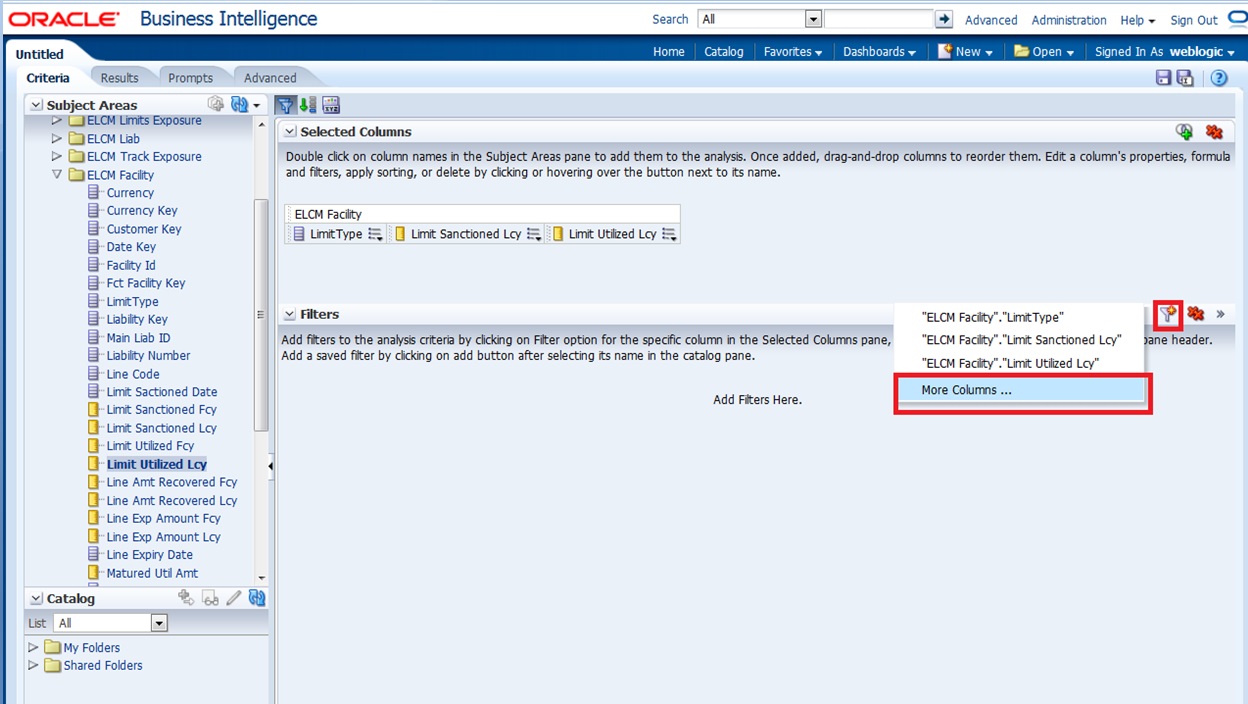
Click ‘Filter’ icon and select ‘More Columns’ to select the filters that you need to apply.
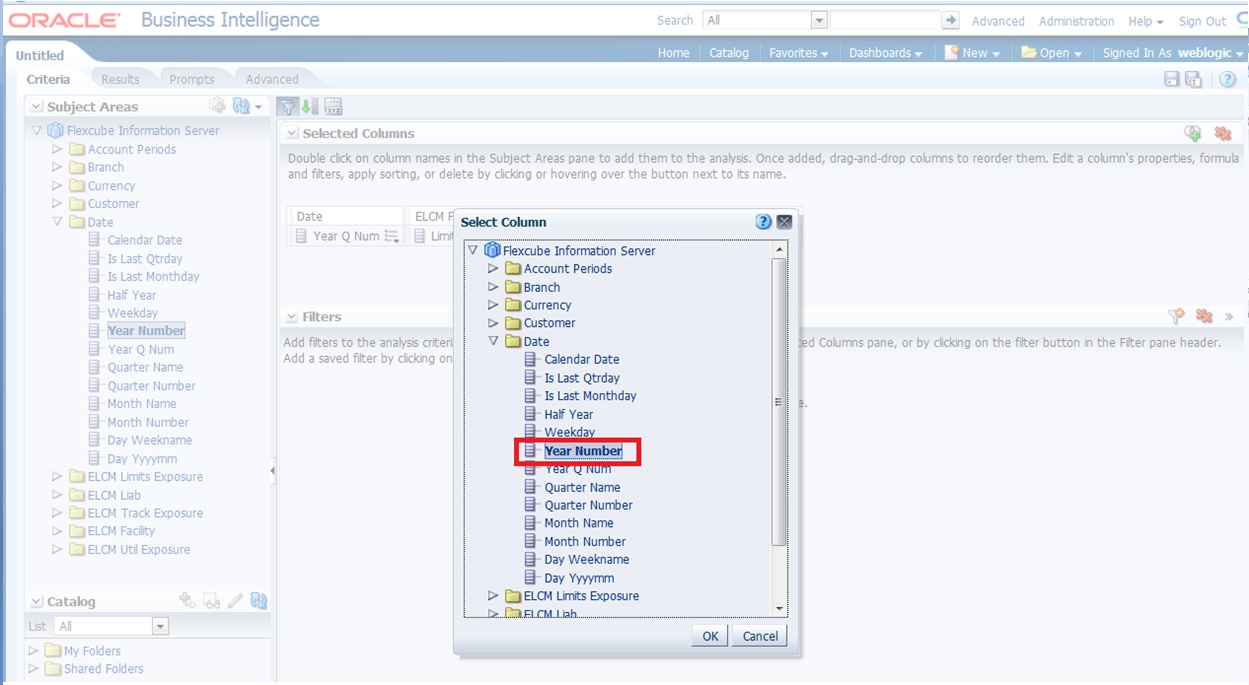
Select the required column and click ‘OK’ button. You will see the ‘New Filter’ window.
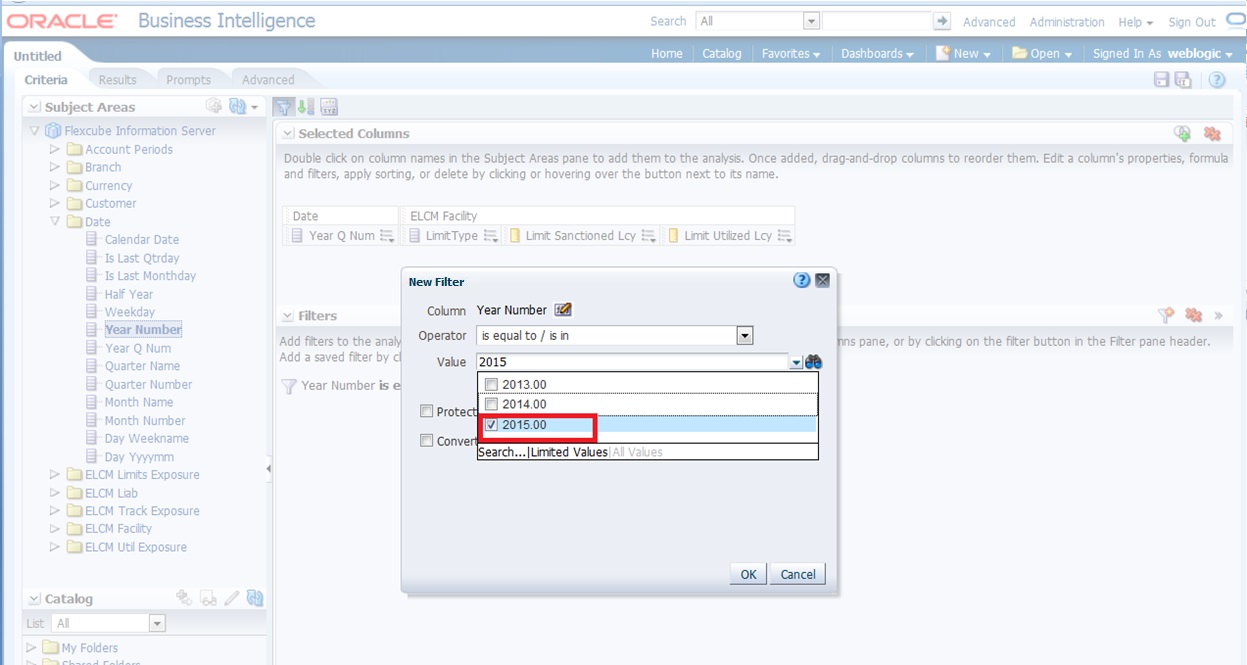
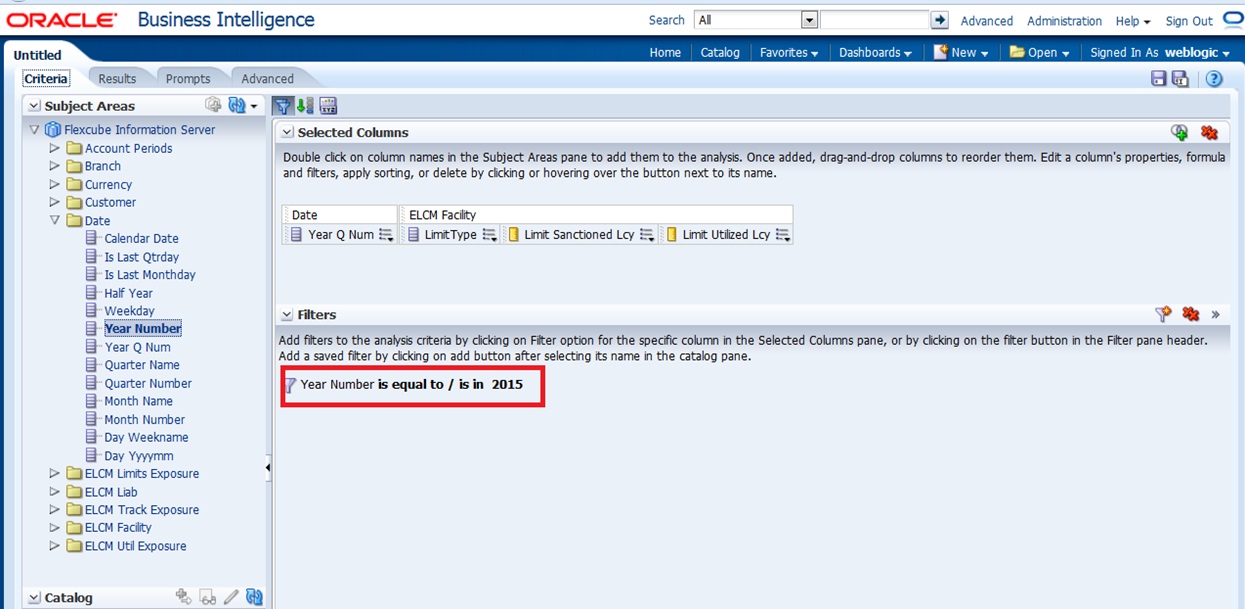
Select the operator and value. Click ‘OK’ button to add the filter. You can add more filters in the same manner.
The ‘Filters’ section of the screen displays all the selected filters.
Once you have added the filters and done the required edits, click ‘Results’ tab.
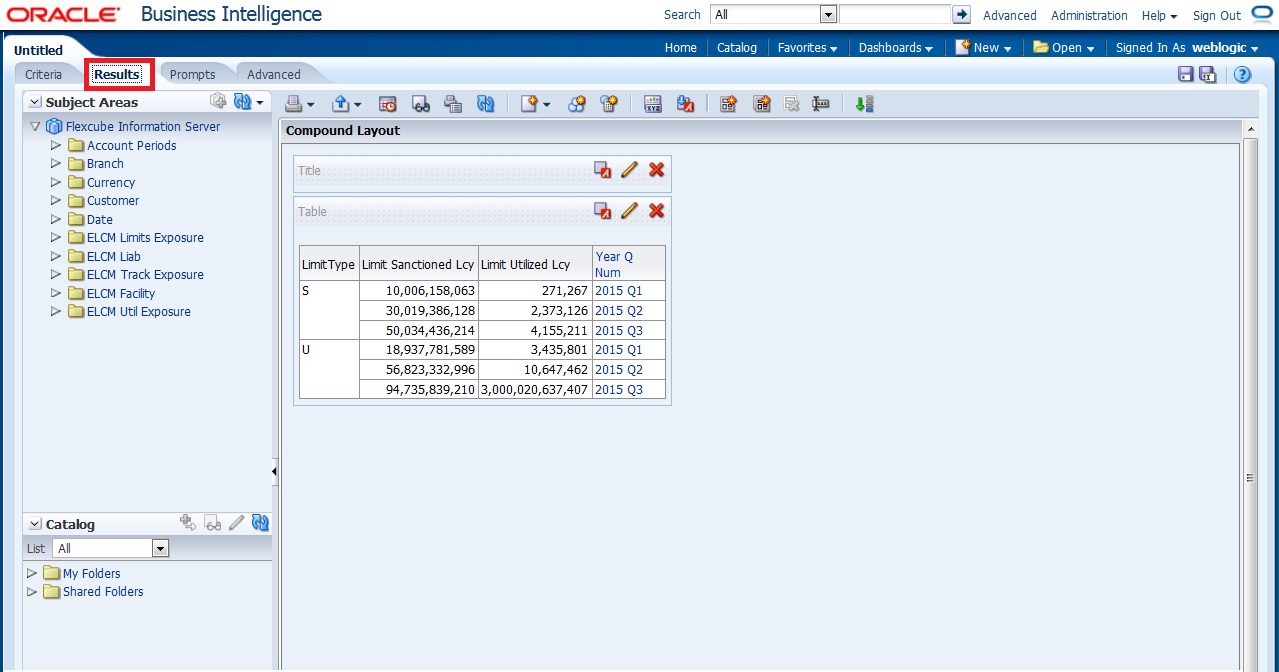
From this tab, you can add graphical representation of the data by using the new view button.
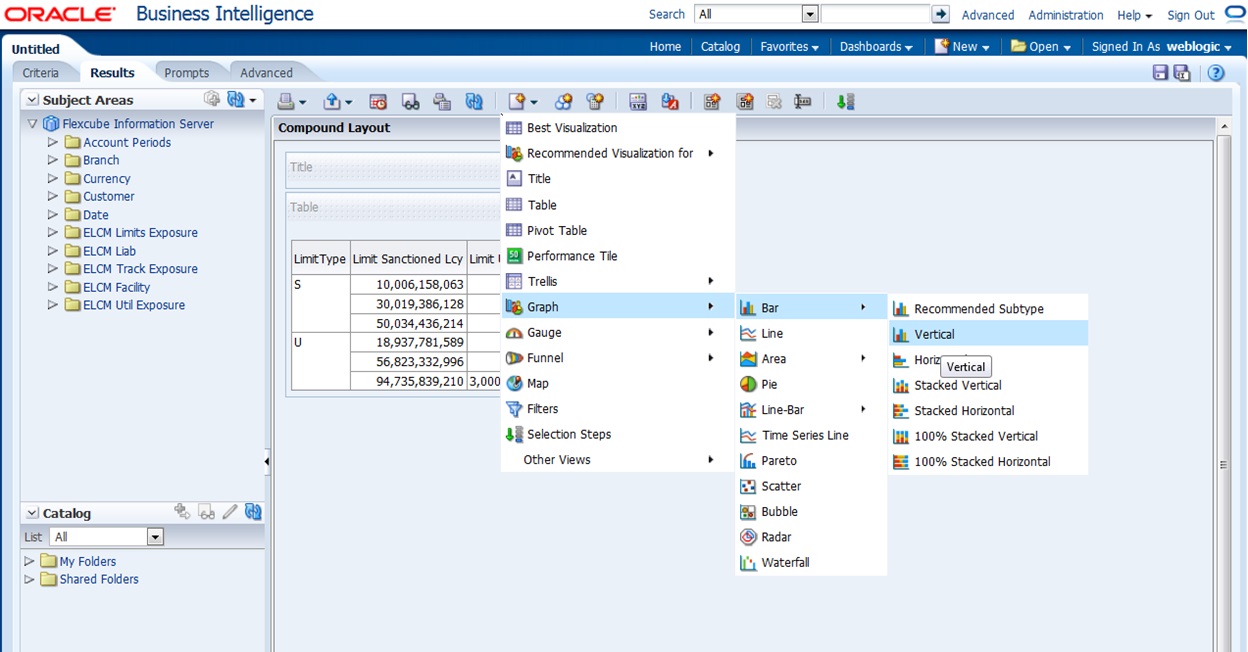
Select the type of graphical representation that you need to add.
OBIEE displays the graph in the result area.
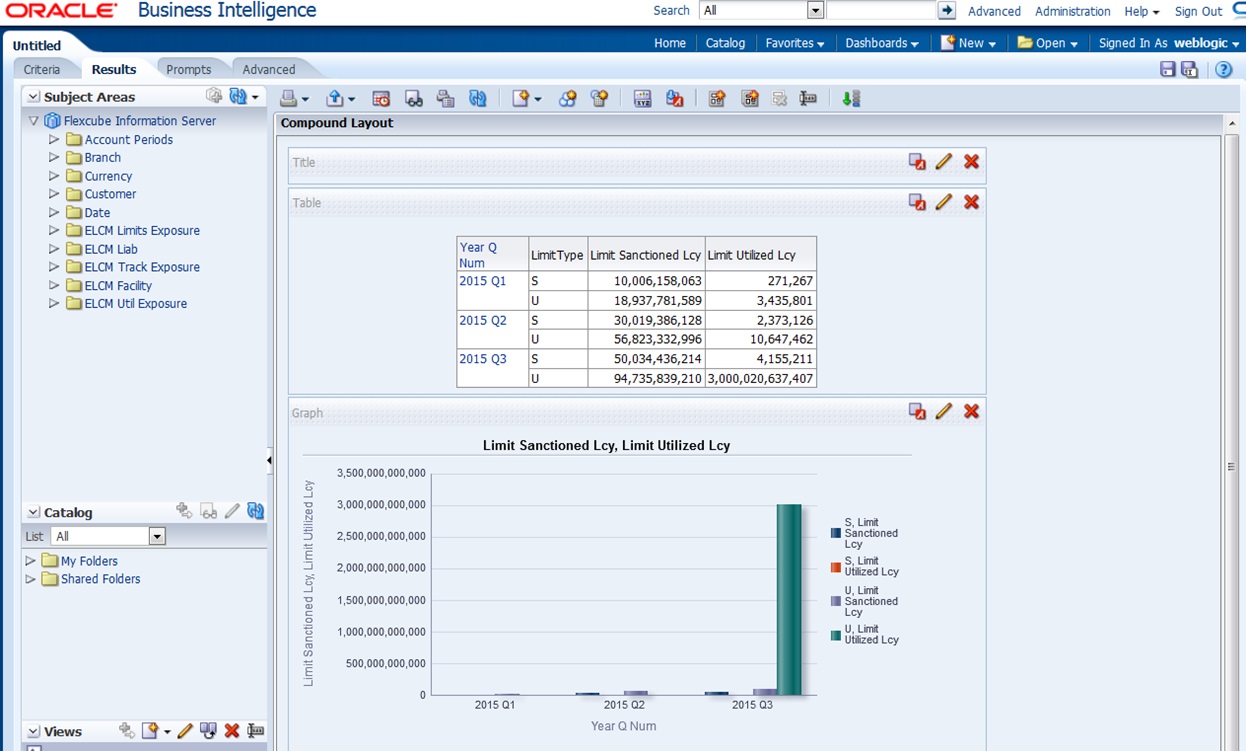
You can drag and drop the items in the result and rearrange the display. If you want to edit the properties of the graph, click Edit icon on the graph item toolbar.
Once the changes are made, click Save icon to save the report that you have created. OBIEE prompts you to specify the name of the report to save
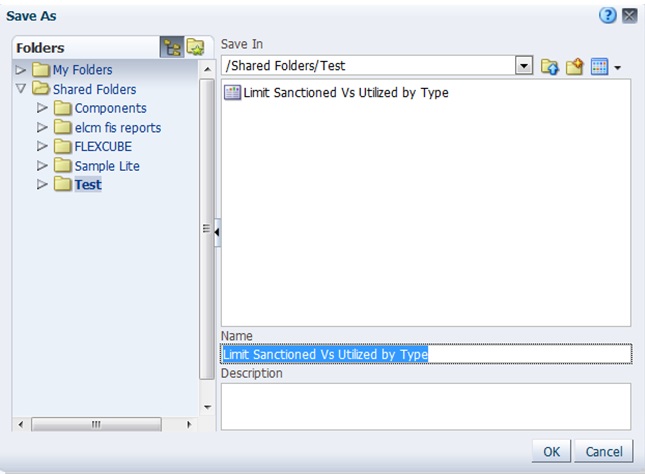
Give an appropriate name to the report and click ‘OK’ button to save it.
You may also add this dynamic report to a dashboard in OBIEE.
For details on creating dashboards and adding reports to dashboard, refer to the documentation of Oracle Business Intelligence Enterprise Edition.