Dashboards
Similar to other software applications, the dashboard in Unifier is a user interface that provides a view of important performance indicators and data related to the shell, organization, or company.
The shell dashboard is a general view of a specific shell's data, and it is not specific to any one user view of data; therefore, the administrators can create multiple shell instance dashboards per shell.
Administrators can configure the dashboard from the Dashboards sub-node, under the Setup node:
- Go to the applicable shell and switch to Admin mode
- In the left Navigator, select Setup, and then select Dashboards.
The Dashboards log contains a list of existing dashboards, and the details are listed in the following columns:
- Name
- Description
- Last Modified By
- Last Modified Date
Use the gear menu ( ![]() ) located next to each item on the log to conduct the following on each dashboard listed:
) located next to each item on the log to conduct the following on each dashboard listed:
- Open
- Copy
- Mark as Default (Unmark as Default)
- Delete
Depending on the setup, this option will change. If the Mark as Default option is available, the selected dashboard name will replace the label My Dashboard on the shell landing page. If the Unmark as Default option is available, the label My Dashboard will replace the selected dashboard name on the shell landing page.
The Dashboards log also lets an administrator:
- Create, delete, or find dashboards by using the following toolbar options:
- Create
- Delete
- Find on Page
- Change the dashboard properties and set permissions within the following tabs on the right pane:
- Properties tab
- Change the dashboard name (Name)
- Provide a description for the dashboard (Description)
- Permissions tab
- Displays the Selected Users/Groups
- Enables you to Add User
- Enables you to Delete User
- Properties tab
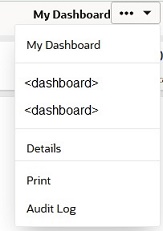
If a user has the View permission, the user can only view an existing dashboard by going to the shell, switching to User mode, selecting Home in the left Navigator, clicking the My Dashboard submenu, and selecting the <dashboard>, as shown below.
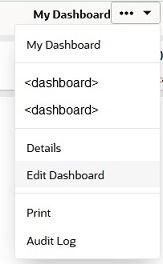
If a user has the Edit permission, the user can edit an existing dashboard by going to the shell, switching to User mode, selecting Home in the left Navigator, clicking the My Dashboard submenu, and selecting Edit Dashboard, as shown below.
A user who creates a shell can create a dashboard for that shell.
Last Published Tuesday, May 6, 2025