6.1.9 IDIH Trace Statistics
The IDIH gathers statistics based on the trace selected from the trace list panel.
Figure 6-9 Trace statistics

Table 6-7 Trace statistics field
| Field | Description |
|---|---|
| Back | Navigates to trace list panel. |
| Refresh | Reloads the current screen. |
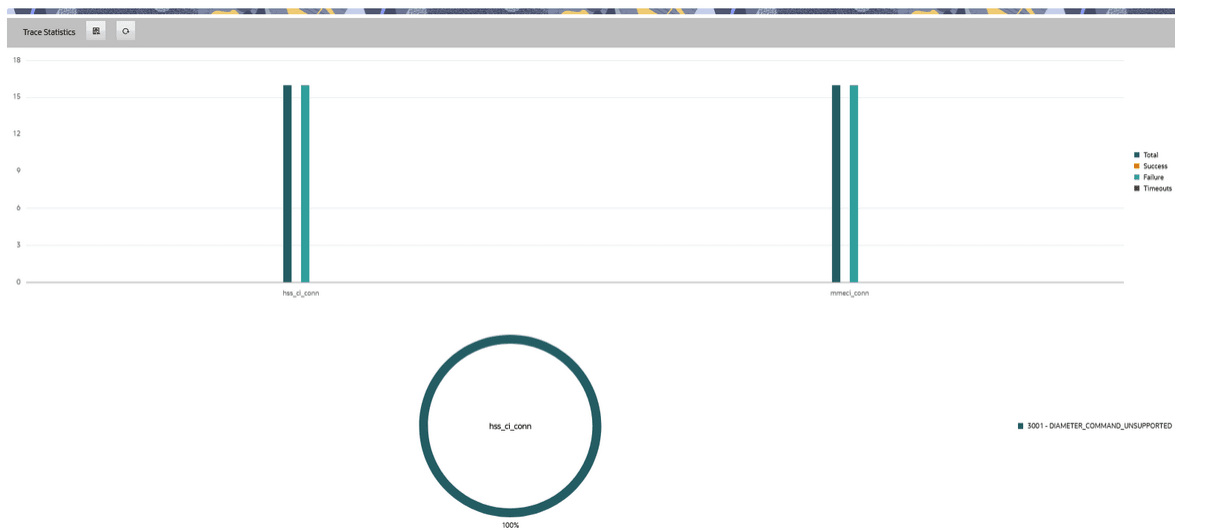
The statistics have various dimensions:
- Total: displays the total value.
- Success: displays the successful value of traces.
- Failure: displays the failed value of traces.
- Timeouts: number of time-out transactions.
Figure 6-10 Trace statistics

The statistics count the number of transactions for every combination of dimension values seen in received transactions. It counts transactions with result code only. If the TTR is missing an Answer message or the Answer message is missing a result code AVP, then the transaction is not counted. The statistics are continuously generated and stored in an mysql database. The complete statistics will be available up to five minutes after the trace has finished or has been stopped.
ProTrace reads the statistics and displays it in the form of bar and pie charts:
- When you hover over the bar chart, it displays Node, Value, and
Status.
- Node: Name of the trace.
- Value: value of the trace.
- Status: Provides the status of the trace.
Figure 6-11 Bar graph

- Pie chart
When you hover over the pie chart, it displays the Series and Value.
Figure 6-12 Pie chart

- When you hover over the bar chart, it displays Node, Value, and
Status.