Enabling Usage Monitor
To enable Usage Monitor, select the Enable Usage Monitoring option on the Usage Monitoring Options page.
Navigation:
.
By default, this option is not selected. After selecting this option, ensure to restart the application server.
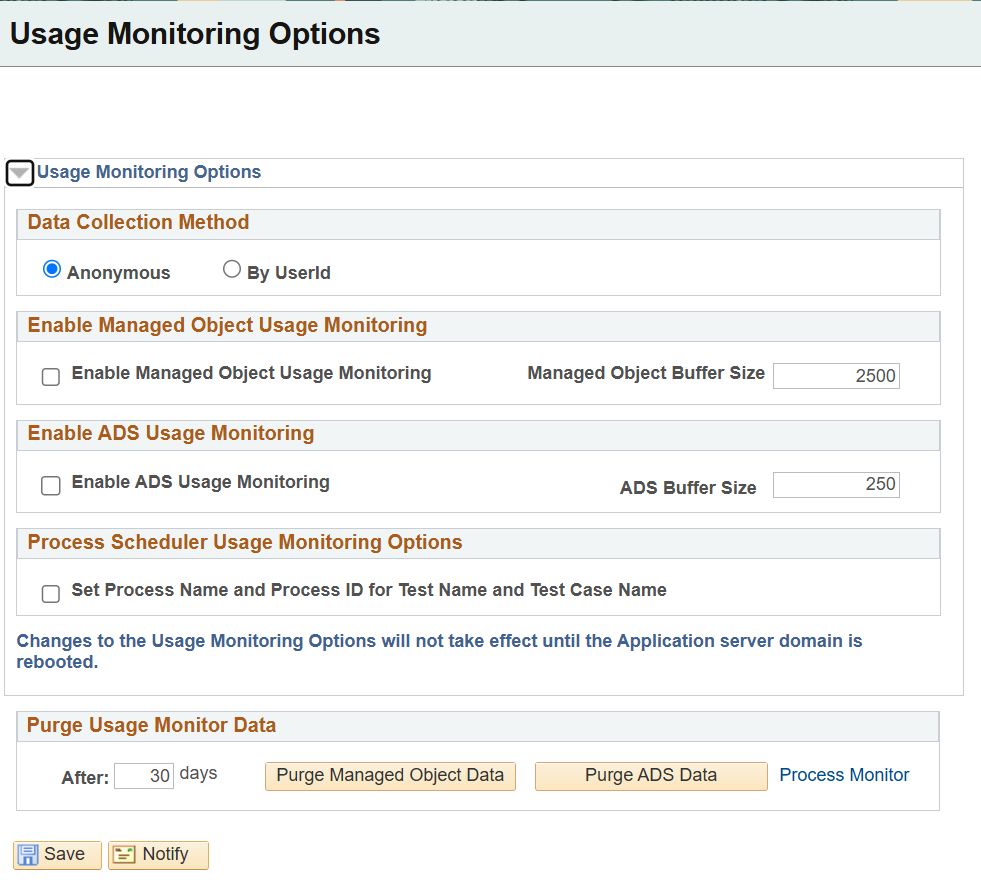
This example illustrates the fields and controls on the Usage Monitoring Options page.You can find definitions for the fields and controls later on this page.
|
Field or Control |
Description |
|---|---|
|
Data Collection Method |
Set the data collection method with:
Selecting By UserId option significantly increases the amount of data collected. For example, if you have ten users who use the same ten objects, then:
You can select an option based on your environment:
The By UserId option should be used only when collecting usage data in the Test and Development environments for use cases that require this level of detail including the following:
|
|
Enable Managed Object Usage Monitoring |
|
|
Enable Managed Object Usage Monitoring |
Select to enable the Usage Monitor for managed objects accessed through application server, Process Scheduler server, and Application Engine server. The use cases for Managed Object usage collection include collecting usage data for use with the LCM Insights feature, collecting usage data in conjunction with the PeopleSoft Test Framework (PTF) tool, and general usage data collection for custom applications. |
|
Managed Object Buffer Size |
Set the buffer limit which determines how much data should be collected in the buffer before storing the data in the database. Depending on the pages that are accessed and your testing needs, you can arrive at an optimum buffer size for your usage pattern. The Buffer Size value affects the performance of the system. Each buffer row requires 1000 bytes of memory, such that a Buffer size value of 200,000 will require 190 MB of available memory. While the buffer maintains a unique set of objects, the writes to the buffer flush events to the database can result in duplicate data that must subsequently be aggregated. In order to minimize the number of database writes and data aggregation actions, the Buffer value should be set to a relatively large value that is ideally in line with the number of expected number of unique rows. Determining the optimal value for the buffer size will likely take some adjustment once usage collection is up and running and the volume of data being collected is better known. Factors that impacts the expected number of unique rows include:
The buffer writes to the database when:
If the Buffer Size value is set too high, the buffer may never fill, causing the process to write collected data to the database only during the server shutdown event. |
|
Enable ADS Usage Monitoring |
|
|
Enable ADS Usage Monitoring |
Select to enable the Usage Monitor for ADS instances accessed through application server, Process Scheduler server, and Application Engine server. The use cases for ADS usage collection include General usage data collection for custom applications. The list of ADS instances that are monitored and recorded will be those identified in the PSADSTRACKITEM PeopleTools table. |
|
ADS Buffer Size |
Set the buffer limit which determines how much data should be collected in the buffer before storing the data in the database. Depending on the ADS instances that are accessed, you can arrive at an optimum buffer size for usage pattern. The Buffer Size value affects the performance of the system. Each buffer row requires 1000 bytes of memory, such that a Buffer Size value of 200,000 will require 190 MB of available memory. While the buffer maintains a unique set of objects, the writes to the buffer flush events to the Database can result in duplicate data that must subsequently be aggregated. In order to minimize the number of database writes and data aggregation actions the Buffer value should be set to a relatively large value that is ideally in line with the number of expected number of unique rows. Determining the optimal value for the buffer size will likely take some adjustment once usage collection is up and running and the volume of data being collected is better known. Factors that impacts the expected number of unique rows include:
The buffer will write to the database:
If the Buffer Size value is set too high, the buffer may never fill, causing the process to write collected data to the database only during the server shutdown event. |
|
Process Scheduler Usage Monitoring Options |
|
|
Set Process Names and Process ID for Test Name and Test Case Name |
When you select this option, the process name and process ID details get recorded for the usage data monitored by Application Engine server and Process Scheduler server. Note: This is not applicable for application server. |
|
Purge Usage Monitor Data |
|
|
After <N> days |
N specifies the retention period or the number of days during which the Usage Monitor data remains in the PSPTUMPMTAGR table. |
|
Purge Managed Object Data |
Usage Monitor managed object data older than the retention period gets deleted when you click the Purge Managed Object Data button. |
|
Purge ADS Data |
ADS instance data older than the retention period gets deleted when you click the Purge ADS Data button. |
To verify the Usage Monitor configuration:
On the Usage Monitoring Options page, set the Managed Object (MO) buffer size to 50.
Note: Until the Buffer Size value is reached, no Usage Monitor data will be written to the database.
Important! This buffer value of 50 is only for verifying the Usage Monitor configuration, ensuring that data will be quickly written to the Usage Monitor tables. When you are using the Usage Monitor, you need to increase the Buffer Size value to a more appropriate "production" value. The default is 2500. Refer to the documentation of Managed Object Buffer Size given in the preceding table.
Shutdown and restart the application server domain and the PeopleSoft Internet Architecture.
Login to that application with your browser and navigate through a few pages and menus in the application.
With your SQL query tool, submit the following query on the monitoring database for managed objects:
SELECT * FROM PSPTUMPMTAGRNote: The Usage Monitor managed object data is collected and stored in the PSPTUMPMTAGR table.
With your SQL query tool, submit the following query on the monitoring database for ADS instances:
SELECT * FROM PS_PTUMADSAGRNote: The Usage Monitor ADS instance data is collected and stored in the PS_PTUMADSAGR table.
Verify that data is present in the table and that the timestamps correspond to the time you verified the Usage Monitor configuration.
Repeat the previous steps when setting the Buffer Size value to your production value.