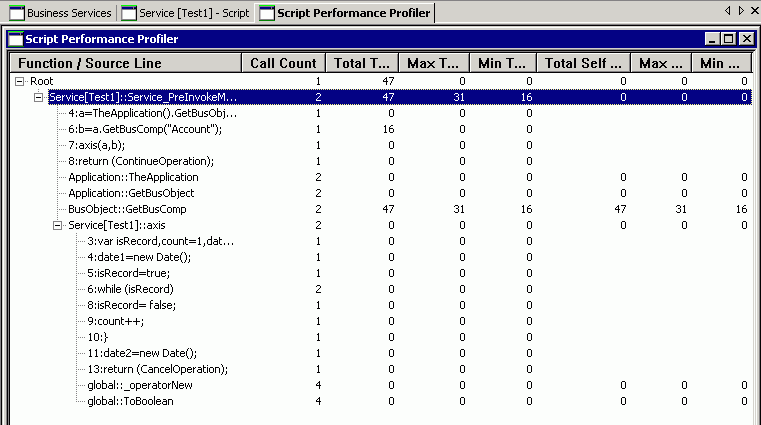
Example of the Script Performance Profiler Window
The following image displays an example of the Script Performance Profiler window. It allows you to examine script performance. It displays a line number for each code line, total time spent to run that line, the number of times Siebel CRM runs the line, and so on.

Description of the Columns in the Script Performance Profiler Window
The following table describes the columns that the Performance Profiler window includes. For the Source Line, Call Count, and Total Time columns, if line profiling is enabled for a function, then the line profile displays as child nodes of a function in the Call Tree view and in the Flat Profile view.
| Column | Description |
|---|---|
Function/Source Line |
Function name and the name of the object that contains the function. For example: |
Call Count |
The number of times Siebel CRM calls a function. You can use one of the following views:
|
Total Time |
Total milliseconds spent in this function and in nested functions. |
Max Time |
Maximum milliseconds spent in this function and in nested functions. |
Min Time |
Minimum milliseconds spent in this function and in nested functions. |
Total Self Time |
The total milliseconds spent in the current function, not including time spent in the subtree of this function. |
Max Self Time |
The maximum milliseconds spent in the current function, not including time spent in the subtree of this function. |
Min Self Time |
The minimum milliseconds spent in the current function, not including time spent in the subtree of this function. |