Bar Charts
A bar chart compares the difference in data from one category to another category. This topic includes examples of different bar charts.
Three Dimensional Bar Chart
The following figure shows a three dimensional bar chart that divides data from source records into categories and displays the total for each category as a vertical bar.
The following figure shows a cluster of bars for categories rather than a single bar if the chart is configured with a Z series axis.
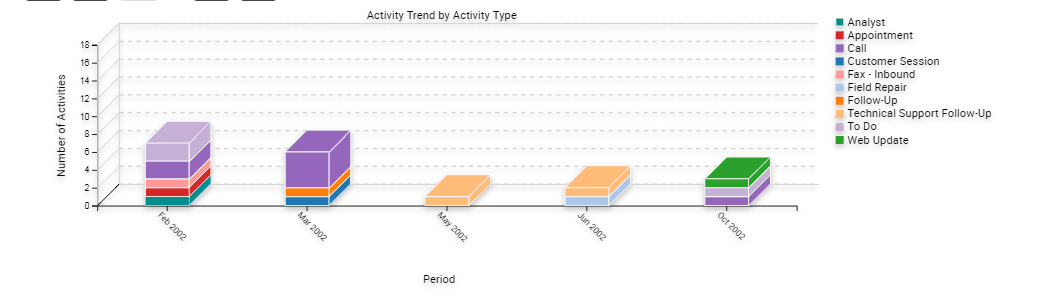
Three Dimensional Stacked Bar Chart
The following figure shows a three dimensional stacked bar chart that normally includes a series axis. The chart displays a single stack of bars for each category. A bar with a different color for each series displays in this stack of bars. A stacked bar chart displays the individual value for each series in the category and the total for the category. In this example, the Project Revenue Analysis chart displays data in the following ways:
-
Data in the values axis corresponds to project revenue.
-
Data in the category axis corresponds to a quarter.
-
Data in the series axis corresponds to the project name.
Each quarter along the X-axis includes a stack of bars. Each bar in the stack indicates the revenue reached in a quarter. The stacks in each bar indicate individual projects.
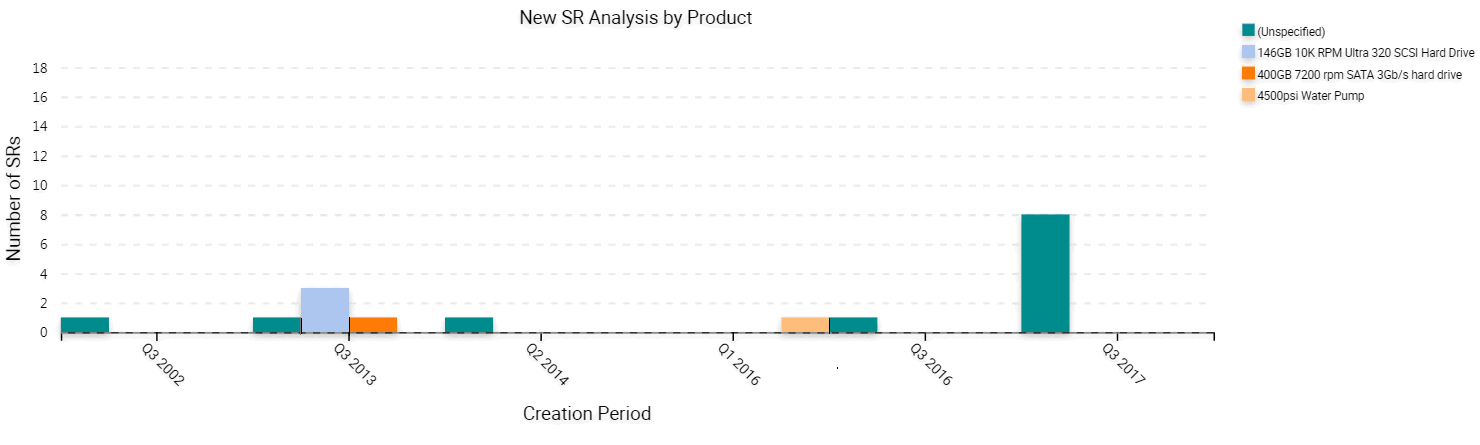
Two Dimensional Bar Chart
The following figure shows a two dimensional bar chart that is functionally equivalent to a three dimensional bar chart except it displays data without the illusion of depth. A two dimensional chart is typically easier to read accurately but might be less visually attractive than the three dimensional chart. If a series axis is present, then the two dimensional bar chart displays bars in a cluster.
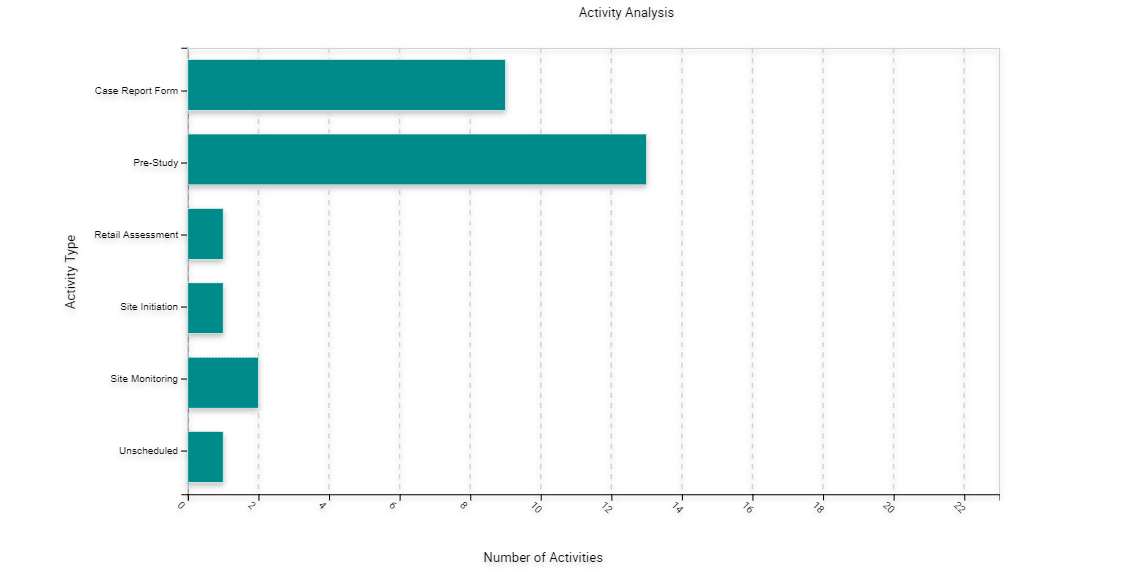
Two Dimensional Horizontal Bar Chart
The following figure shows a two dimensional horizontal bar chart that is functionally equivalent to a two dimensional bar chart except the X-axis and Y-axis are switched.
Two Dimensional Stacked Bar Chart
The following figure includes a two dimensional stacked bar chart that is functionally equivalent to the three dimensional stacked bar chart except it displays without the illusion of depth.