Configuring Lists in Chart Applets
A chart applet typically provides one or more lists that allow the user to determine how Siebel CRM displays or uses data. The following figure shows an example of a chart applet.
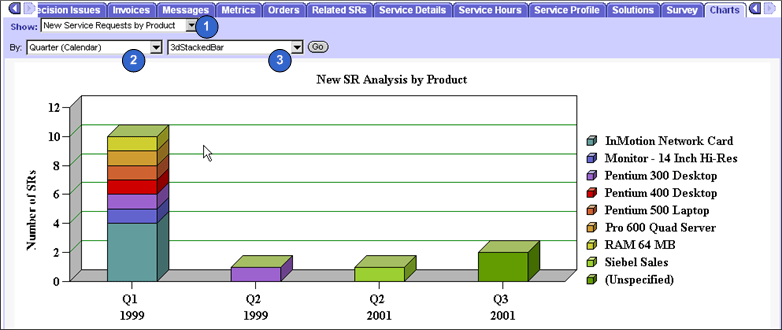
As shown in this figure, the following types of lists are available:
-
Show list. Allows the user to modify data that Siebel CRM displays on the Y-axis. For more information, see Configuring the By List of a Chart Applet.
-
By list. Allows the user to modify data that Siebel CRM displays on the X-axis. For information, see Configuring the By List of a Chart Applet.
Second By list. Allows the user to choose the source field that provides data for the Z-axis. For more information, see Configuring the Second By List of a Chart Applet.
-
Type list. The most common of the four lists. Siebel CRM displays it in most chart applets and allows the user to choose a different type of chart for the same data, such as a pie chart instead of a bar chart, or a two-dimensional line chart instead of a three-dimensional chart. For more information, see Types of Charts.
You can use a comma separated list of chart type names in the Picklist Types property of the chart object definition to define options for the type list. For example:
3dBar,3dStackedBar,3dPie,3dHorizBar,2dBar,2dStackedBar,2dPie,2dHorizBarSiebel CRM does not allow spaces between the elements in the comma separated list.
The default type is the chart type that Siebel CRM displays the first time it displays the chart. This default is defined in the Type property. A chart that does not include a type list uses the Type property to define the chart type. The user cannot modify a chart that does not include a type list.