Scatter Charts
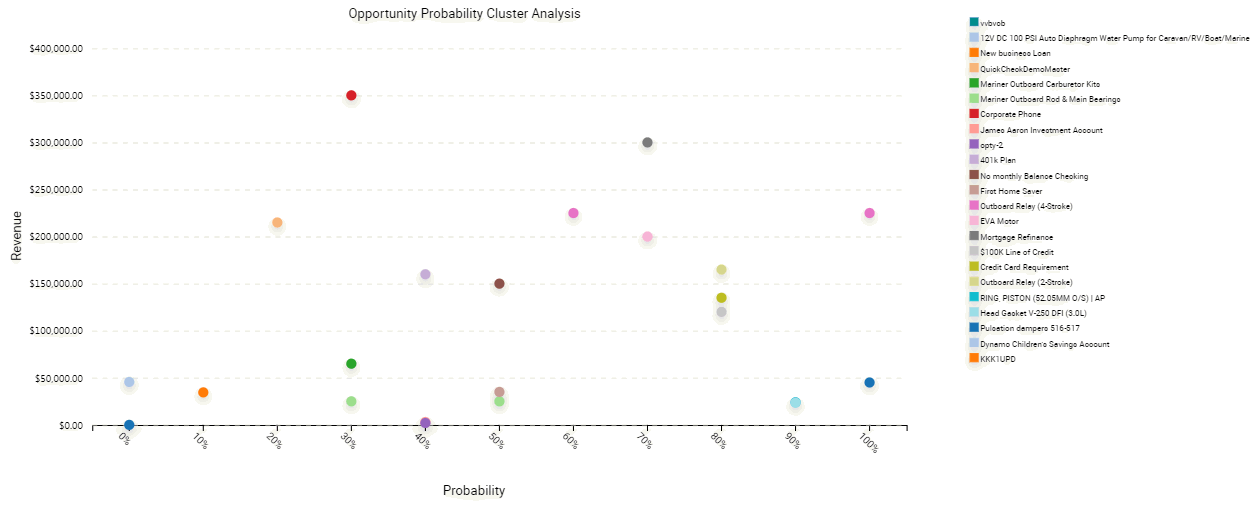
A scatter chart is a type of that displays the distribution of data across two dimensions, which is useful for probability distribution and other uses. The category axis must contain only numeric data, so you cannot convert the two dimensional scatter chart to other chart types, such as the bar chart, line chart, or pie chart. For this reason, the following conditions apply for the two dimensional scatter chart:
-
Does not display in the Type list
-
Does not include a Type list
The following figure includes a two dimensional scatter chart.
