5.1.6 Ladder Diagram
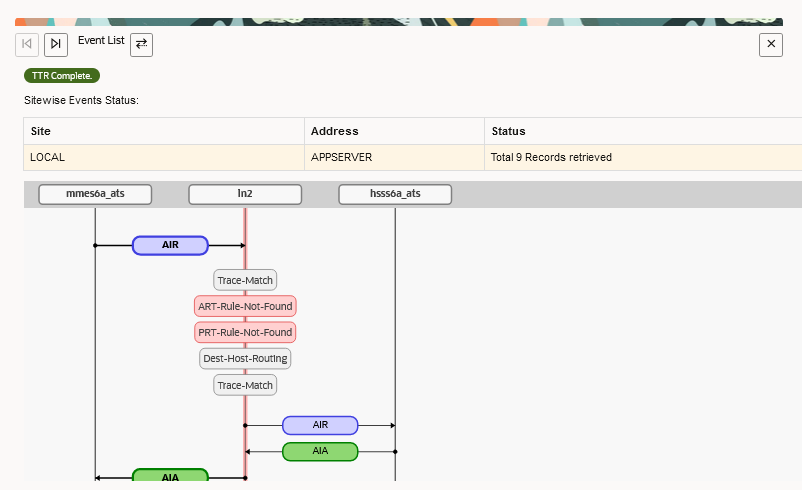
The Ladder Diagram graphically represents the TTR events, offering more details beyond what is provided in the TTR event panel. Additionally, ProTrace will analyze and display client redirect events as they are received.
you can view the ladder diagram by clicking on any trace from the TDR list.
Figure 5-8 ladder diagram

You can hover over the ladder diagram to view details about that specific bubble in the Diameter Full Decoding Panel. You can also click Toggle button to view events in a table format, which allows a specific row to appear in the Diameter Full Decoding Panel.