Working with the Customization Dashboards
You are provided with two dashboards.
The two dashboards are:
Customization Insights Dashboard
Customization Details Dashboard
The three types of customizations available are:
Custom- Customization that contains objects created by customer.
Customization- Includes both PeopleSoft-delivered objects and customer-modified objects.
False-Positive- This customization contains only PeopleSoft-delivered objects. However, it appears as customized due to unintended saves, troubleshooting edits and so on.
The Customization Insights Dashboard is used by the executive level users.
Navigate to .
Only the Customization type customization data is available in the this dashboard as executive level user only need to know about Customizations.
Utilize the available visualizations to assess the level of customizations. Based on this assessment, you can determine the appropriate maintenance activities.
This example illustrates the fields and controls on the Customization Insights Dashboards.
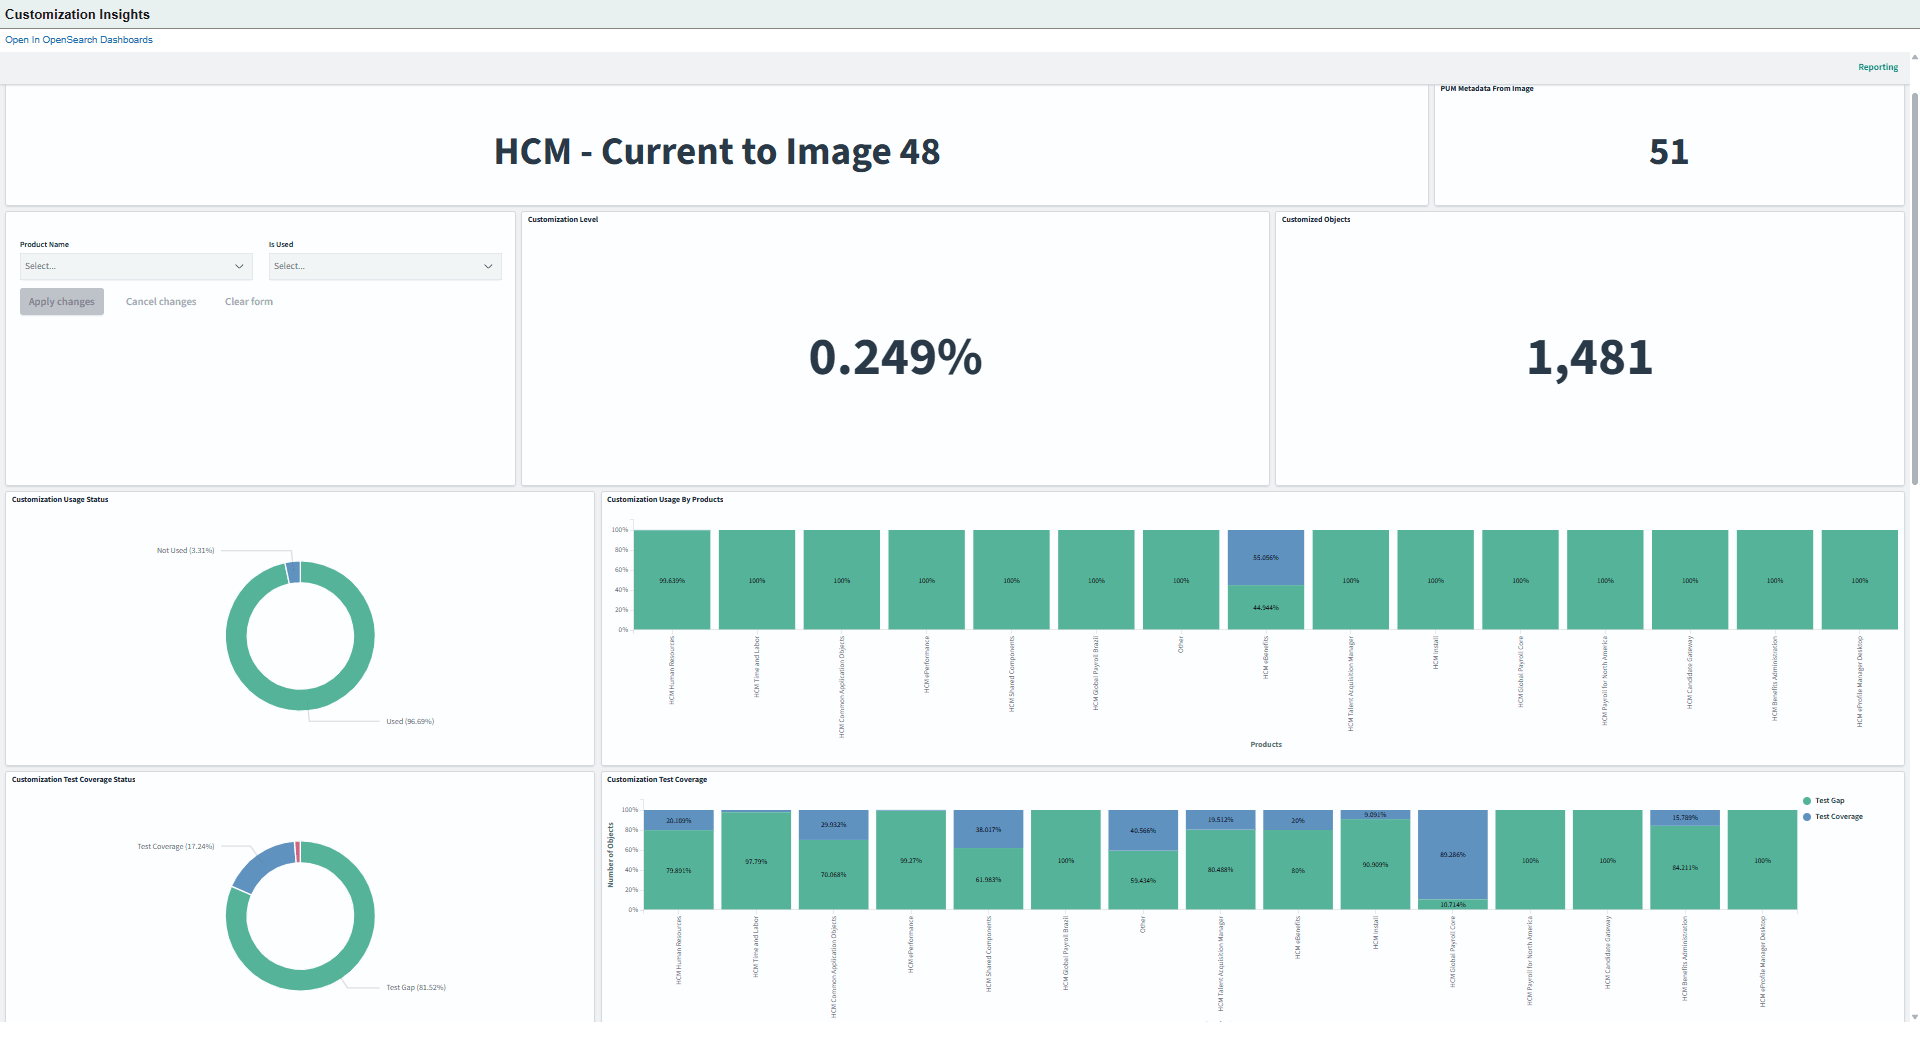
The various visualizations in this dashboard display data based on these filters:
Product Name- lets you to select products, such as, HCM Benefits or HCM Human Resources.
Is Used- lets you to filter objects based on their usage. Two options available are: Not Used and Used.
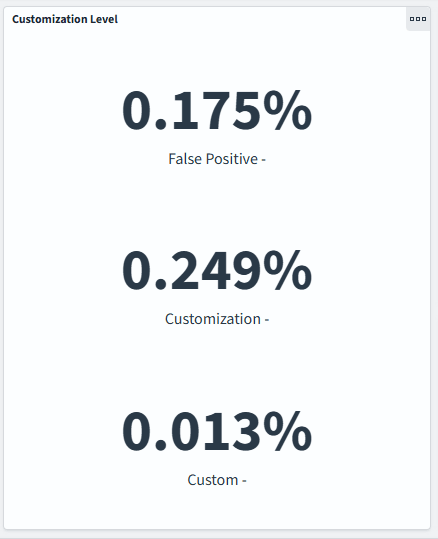
Customization Level
Use Customization Level to view the level of your customizations.
This example illustrates the fields and controls on the Customization Level visualization.
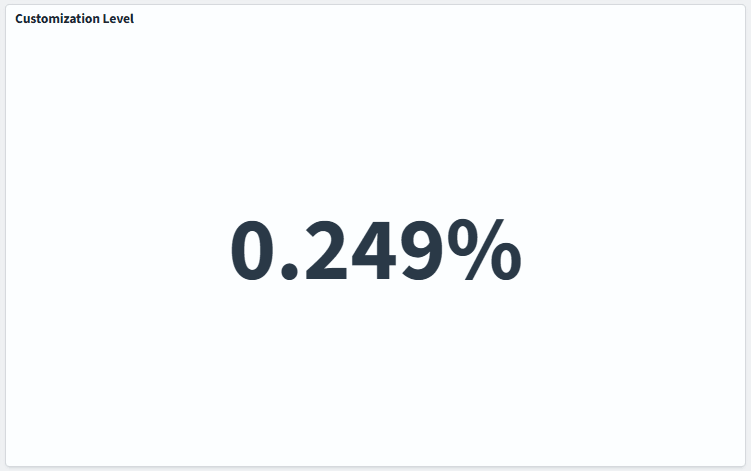
In this example the Customization percent is 0.249%. This represents the proportion of PeopleSoft-delivered objects that have been modified by the customer.
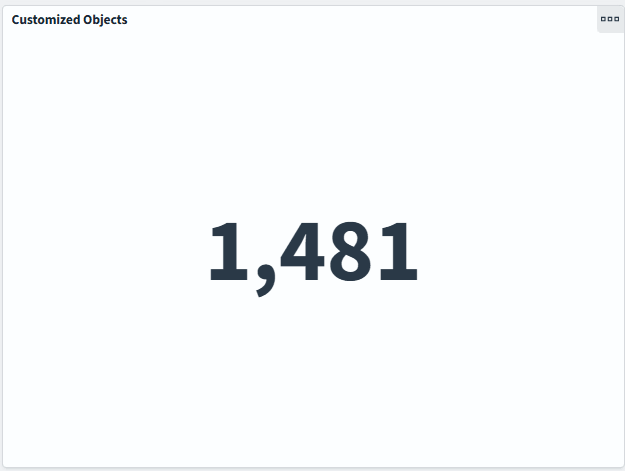
Customized Objects
Use Customized Objects to view the count of customized objects.
This example illustrates the fields and controls on the Customized Objects visualization.
Customization Usage Status
Use Customization Usage Status to view the usage of customizations.
This example illustrates the fields and controls on the Customization Usage Status visualization.
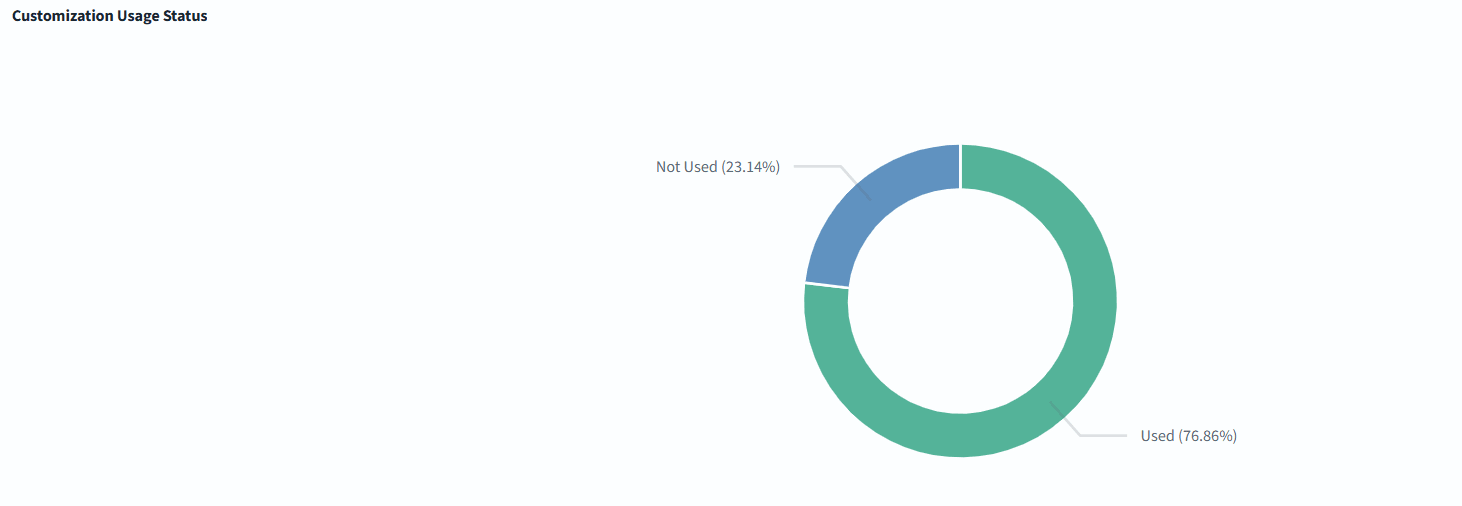
The available segments are:
Used- indicates the percentage of customizations used in the entire product line.
Not Used- indicates the percentage of customizations not used in the entire product line.
Customization Usage by Products
Use Customization Usage by Products to view the percentage of usage of each product.
This example illustrates the fields and controls on the Customization Usage by Products visualization.
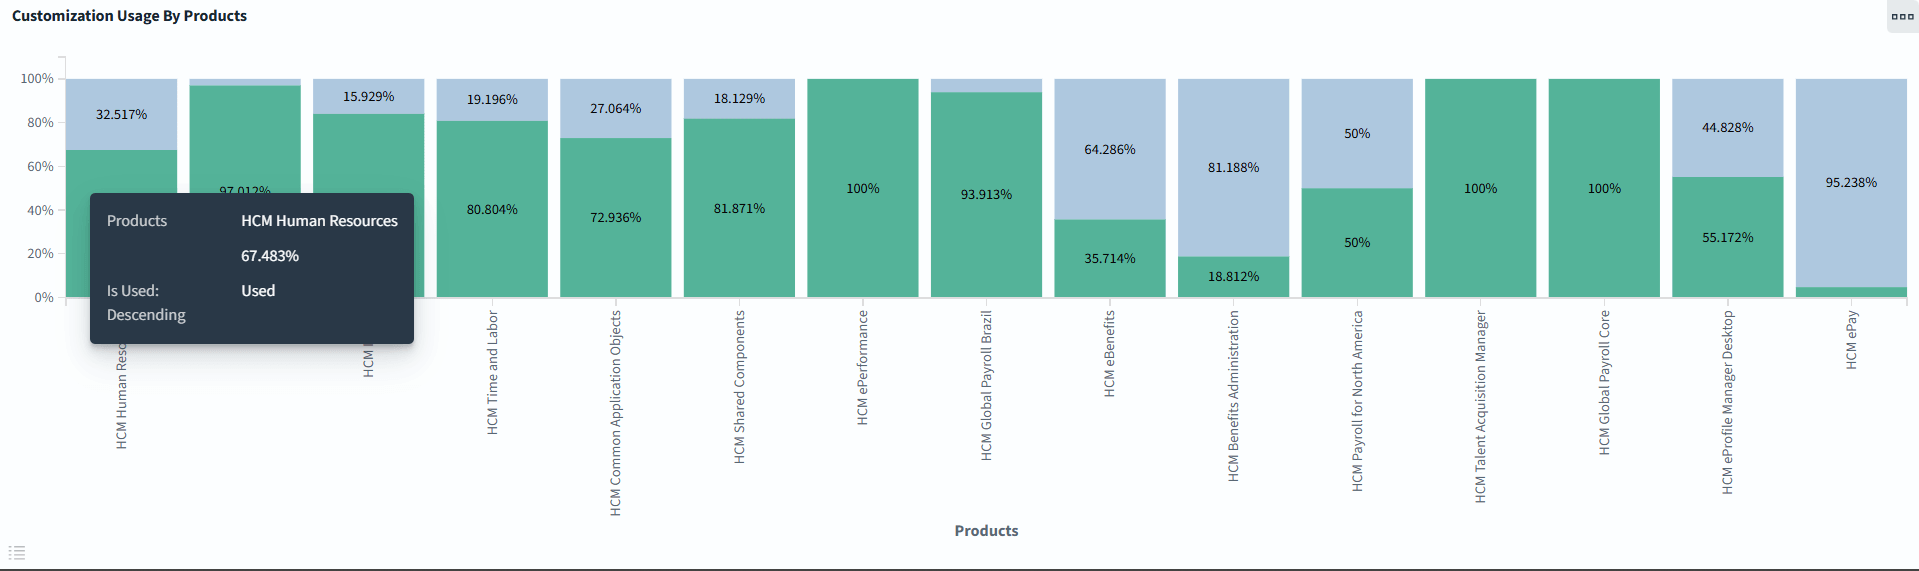
The available segments are:
Green- indicates the percentage of customizations that users have actively used for a specific product.
For example, if users utilize five out of ten HCM eBenefits customizations, then fifty percent of eBenefits customizations are in use, while the remaining fifty percent are unused.
Blue- indicates the percentage of customization not used by the product.
In this example, both HCM ePerformance and Global Payroll Core utilize all customizations, as indicated by their 100% usage.
Customization Test Coverage
Use Customization Test Coverage to view the percentage of test coverage across different products.
This example illustrates the fields and controls on the Customization Test Coverage visualization.
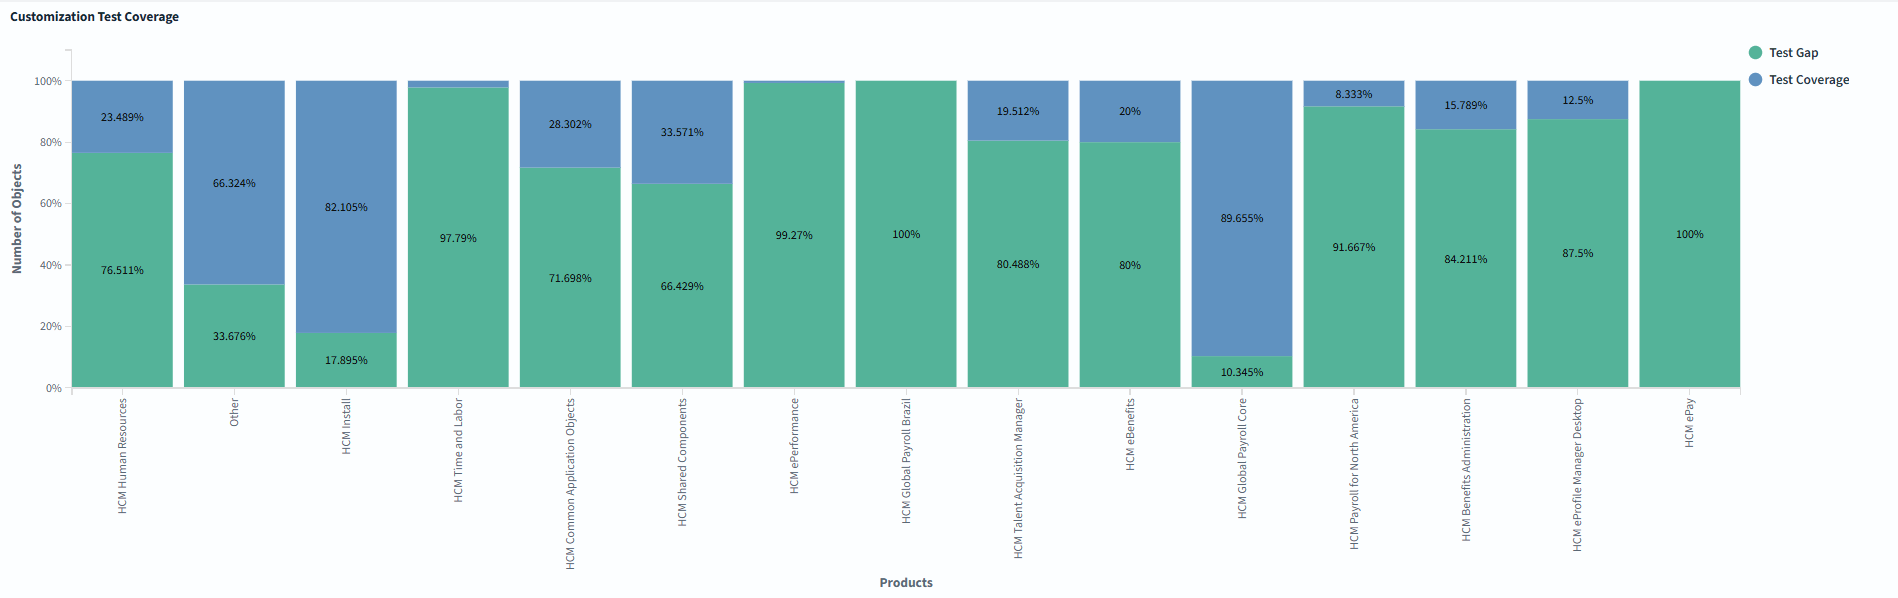
The available segments are:
Green- indicates the percentage of customizations not covered by test.
Blue- indicates the percentage of customizations covered by tests.
Use this data to improve test coverage of products with high test gaps to mitigate risks of defects and unsupported changes.
Customization Test Coverage Status
Use Customization Test Coverage Status to view the test coverage of customizations by comparing the presence and usage of customizations between the customer’s test and production environments.
This example illustrates the fields and controls on the Customization Test Coverage Status visualization.
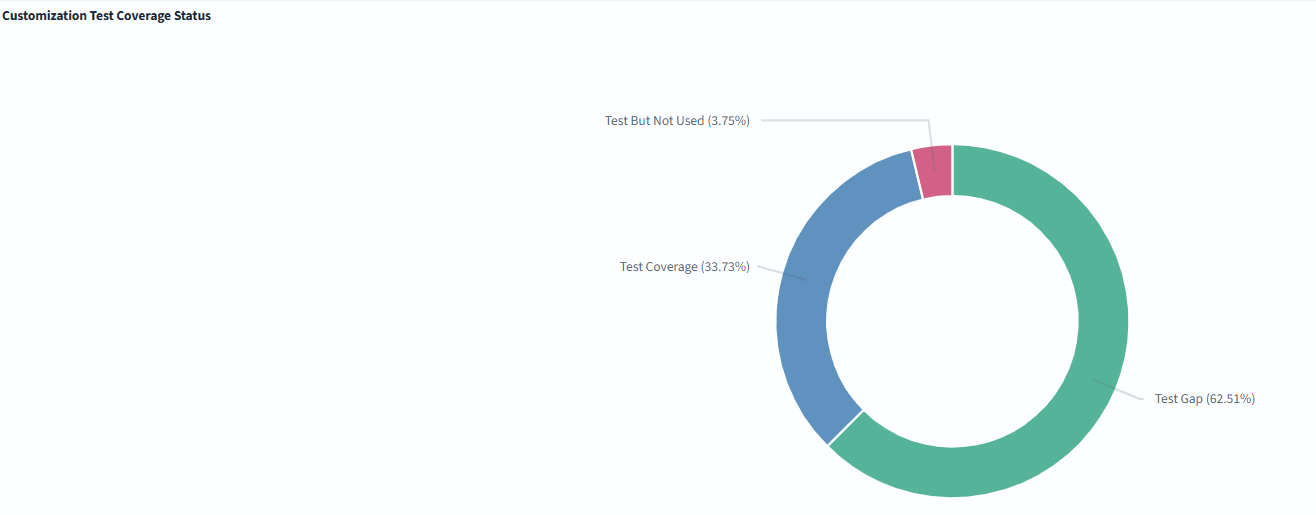
The available segments are:
Test Gap- which is identified by the green color shows the percentage of customizations that have not been covered by any tests.
Test Coverage- which is identified by the blue color shows the percentage of customizations that are actively covered by the tests.
Test But Not Used- which is identified by the red color shows that tests exist for a certain percentage of customizations, but these customizations are not currently used in Production environment.
Customization Over Time
The Customization Over Time analytic tracks the number of customized objects as they are added to the Insights over a time period.
This example illustrates the fields and controls on the Customization Over Time visualization.
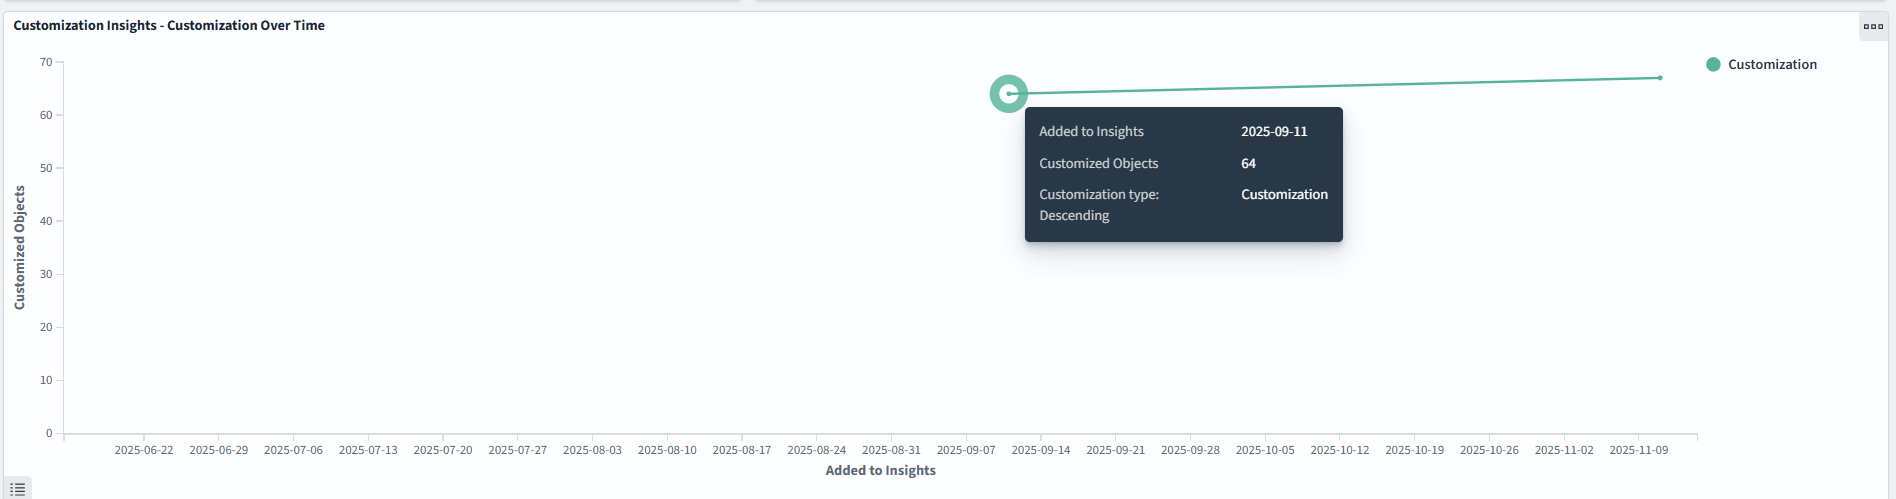
The X-axis shows the date or time when customizations are added to the Insights.
The Y-axis shows the number of customized objects.
This visualization helps you instantly pinpoint when the majority of customizations entered the system. Trends like this are important for understanding system changes, planning for support, or assessing the impact of large deployments.
Unused Customization Testing
Use Unused Customization Testing to view information on the number of unused customization tests across various products.
This example illustrates the fields and controls on the Unused Customization Testing visualization.
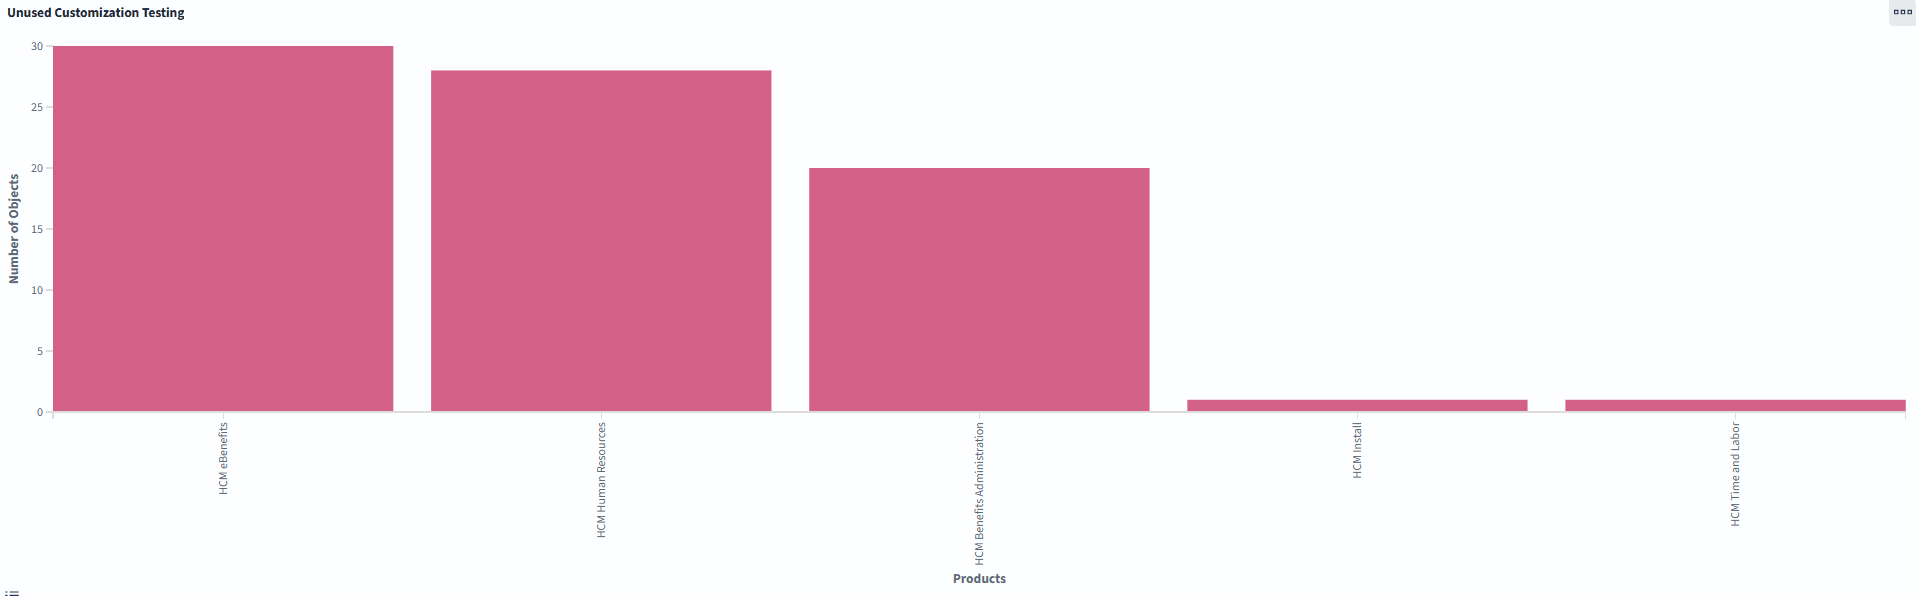
Unused customization tests typically indicate tests that exist for customizations which are not actively being used.
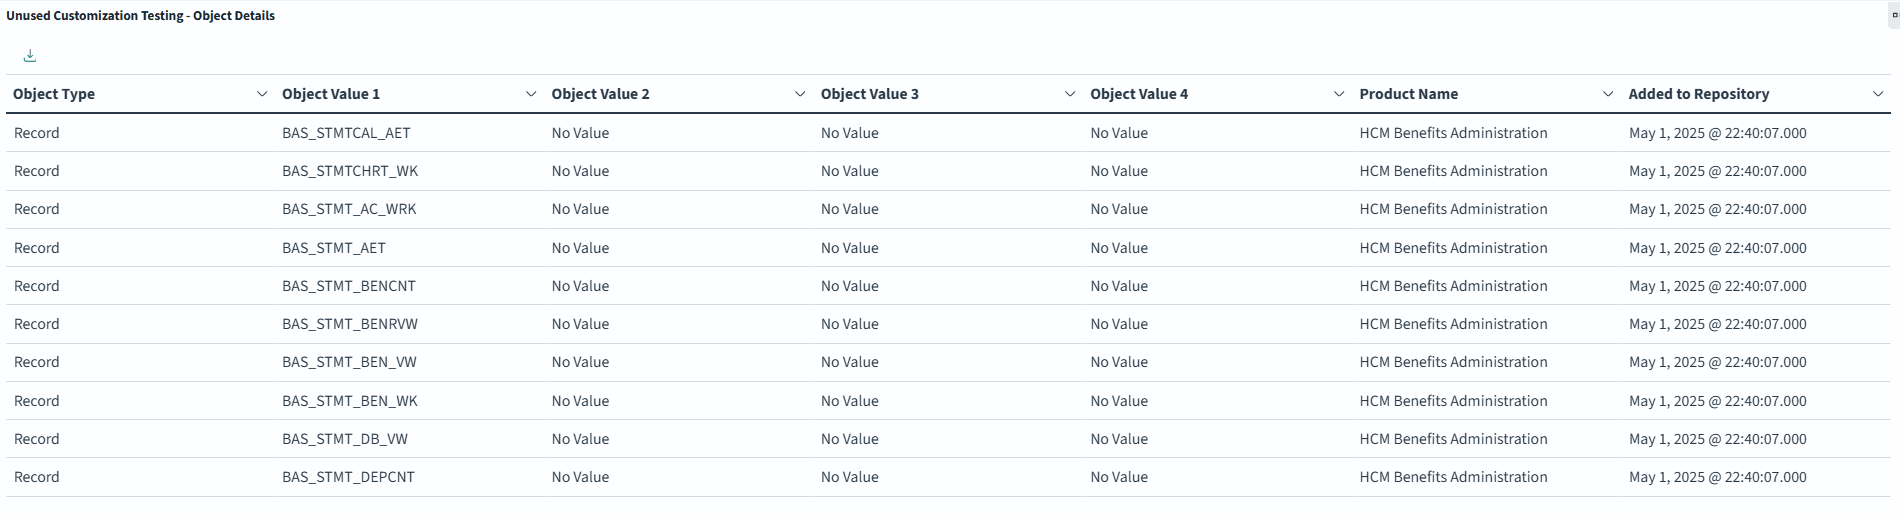
Unused Customization Testing- Object Details
The Unused Customization Testing- Object Details analytic provides a detailed view of specific customization objects that have associated test cases but are currently not in use.
This example illustrates the fields and controls on the Unused Customization Testing- Object Details visualization.
|
Field |
Description |
|---|---|
|
Object Type |
The data objects that have associated test cases but not is not being used. |
|
Object Value 1-4 |
Displays the object name and other identifiers. |
|
Product Name |
Displays the product with which this object is associated. |
|
Add to Repository |
Displays the time when the objects and their unused test cases were added to the repository. |
Products with Customization Impacts
Use Products with Customization Impacts to view a breakdown of the number of retrofits or customization impacts for various products.
This example illustrates the fields and controls on the Products with Customization Impacts visualization.
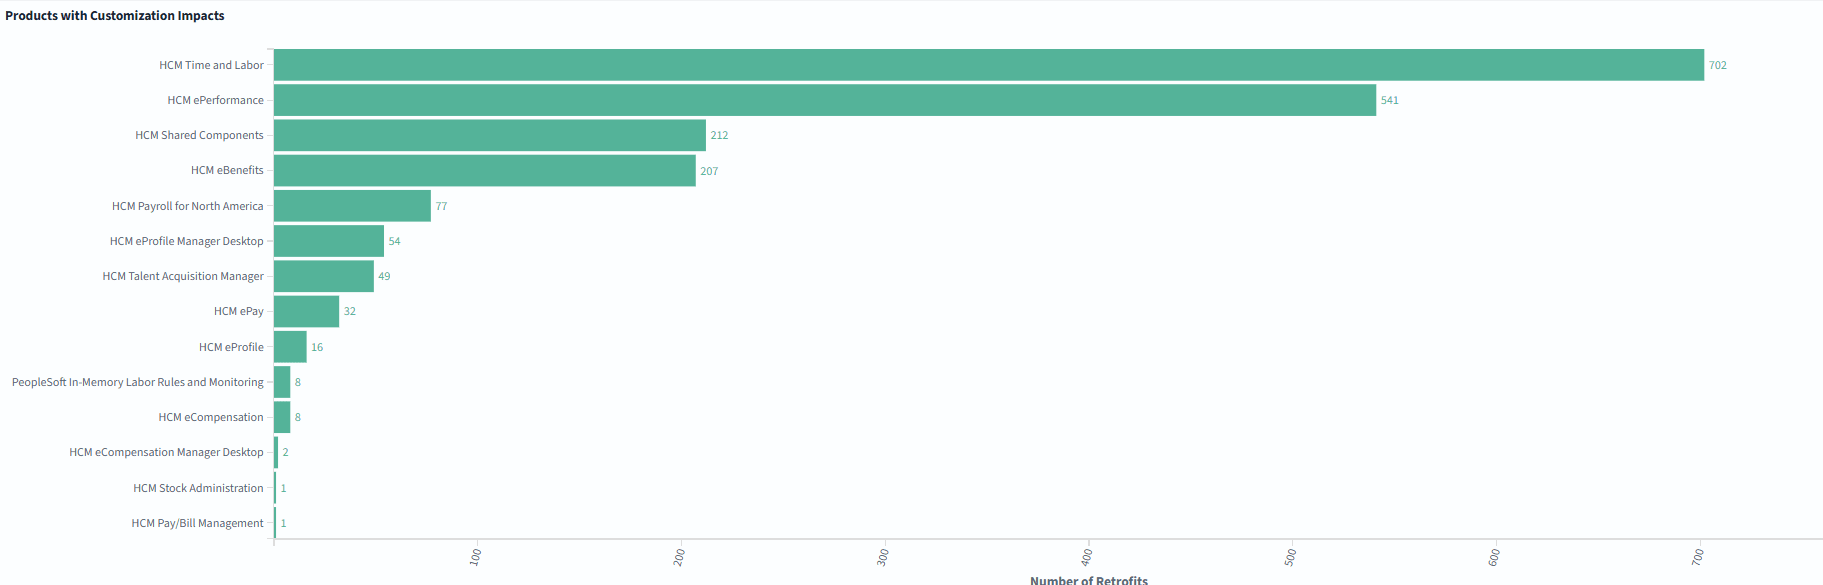
The Y axis represents the products.
The X axis represents the number of retrofits or the instances where customizations have impacted the product.
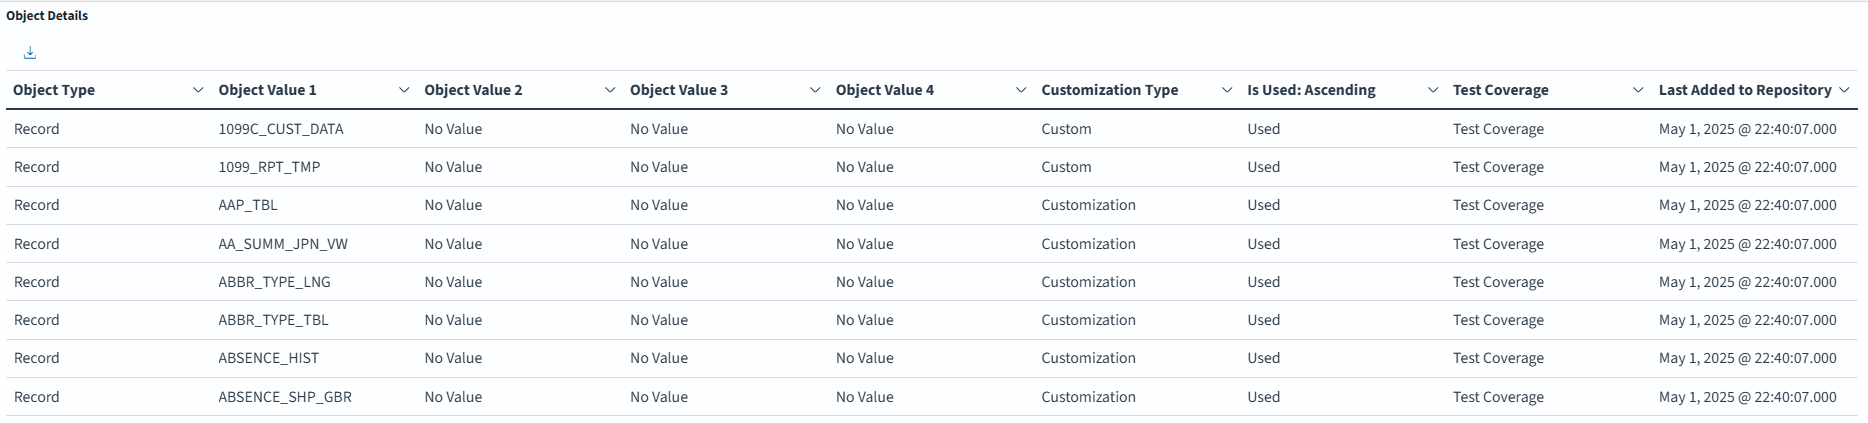
Object Details
Use Object Details to view more details on the object type used.
This example illustrates the fields and controls on the Object Details visualization.
|
Field |
Description |
|---|---|
|
Object Type |
The data objects that have associated test cases but not is not being used. |
|
Object Value 1-4 |
Displays the object name and other identifiers. |
|
Customization Type |
Displays the customization type to which the object is associated with. |
|
Test Coverage |
Indicates that automated or manual testing includes these objects, |
|
Last Added to Repository |
Indicates the time stamp when the object was last added in the asset repository. |
The Customization Details dashboard is used by the administrators.
Navigate to .
This example illustrates the fields and controls on the Customization Details Dashboards for the HCM application.
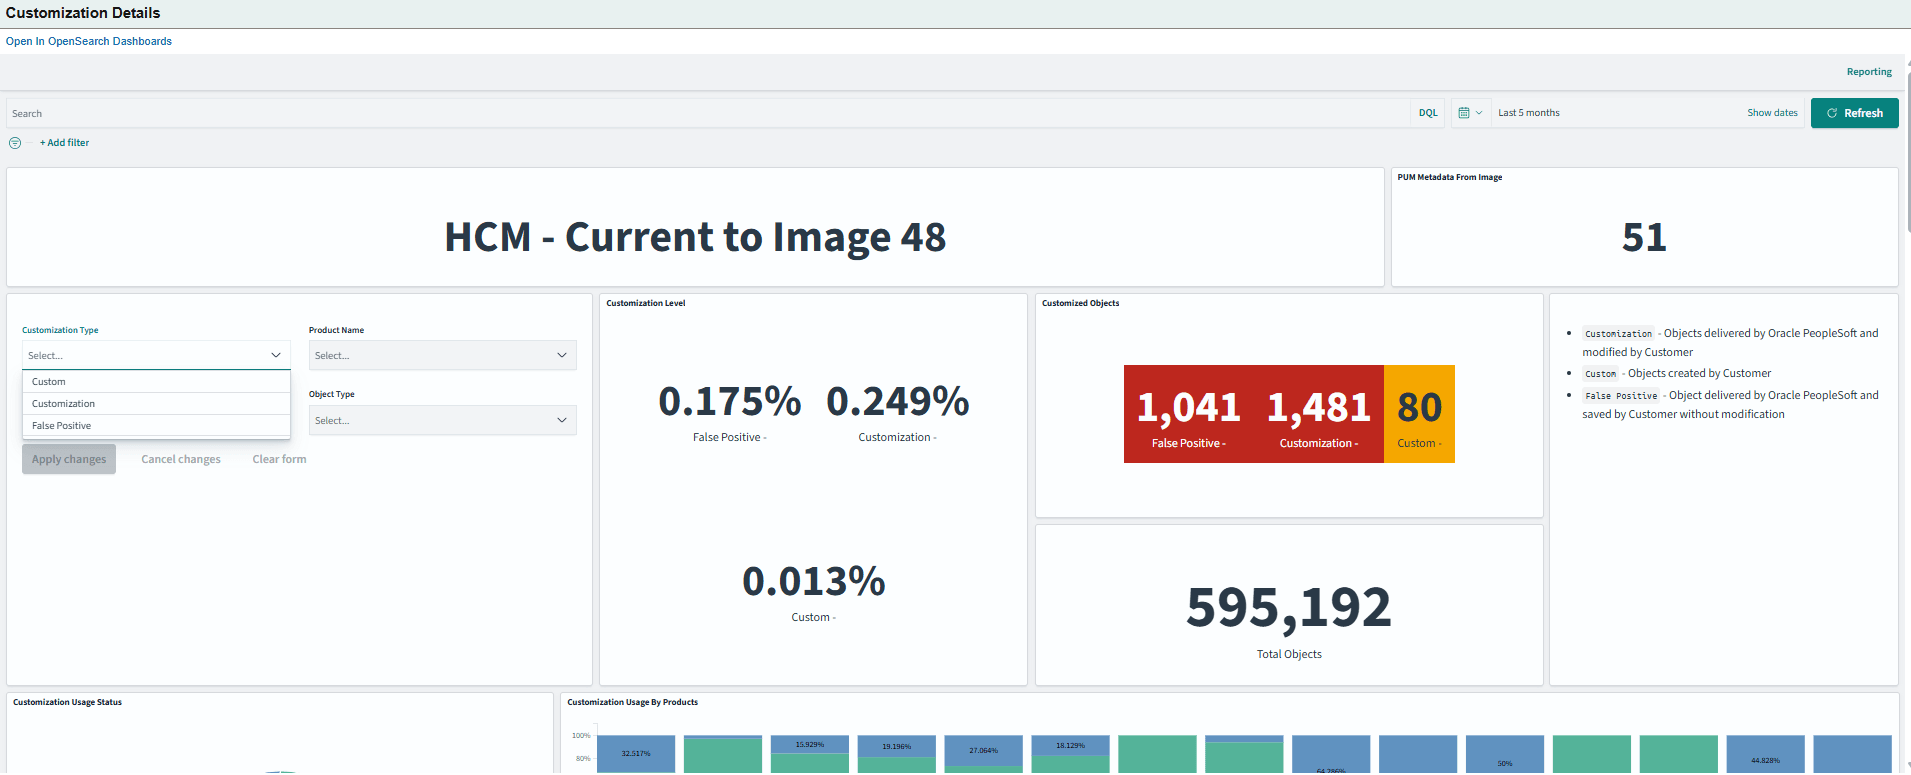
The various visualizations in this dashboard display data based on these filters:
Customization Type- lets you to select the three types of customizations, namely, Custom, Customization, and False-Positive.
Product Name- lets you to select products, such as, HCM Benefits or HCM Human Resources.
Is Used: lets you to filter objects based on their usage. Two options available are: Not Used and Used.
Object Type: This filter lets you to select any specific object (ex: PeopleCode).
All visualizations available on the Customization Insights dashboard are also available on this dashboard. However, the Customization Level and Customized Objects visualization include additional information.
Two additional visualizations are also available.
Customization Level
The Customization Level visualization displays the percentage of customized objects that exist for each customization type.
This example illustrates the fields and controls on the Customization Level visualization.
Customized Objects
Use this to view the current state of object customizations in your environment by categorizing them into False-Positive, Customization, and Custom.
This example illustrates the fields and controls on the Customized Objects visualization.

The additIonal visualizations are:
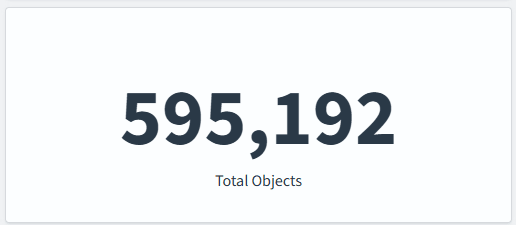
Total Objects
Object Type by Usage
Total Objects
Use Total Objects to view the total number of objects available in the PUM source, which is used as a reference to compare.
This example illustrates the fields and controls on the Customized Objects visualization.
Object Types by Usage
Use Object Types by Usage to view the distribution of object types by usage status within the PeopleSoft environment.
This example illustrates the fields and controls on the Object Types by Usage visualization.
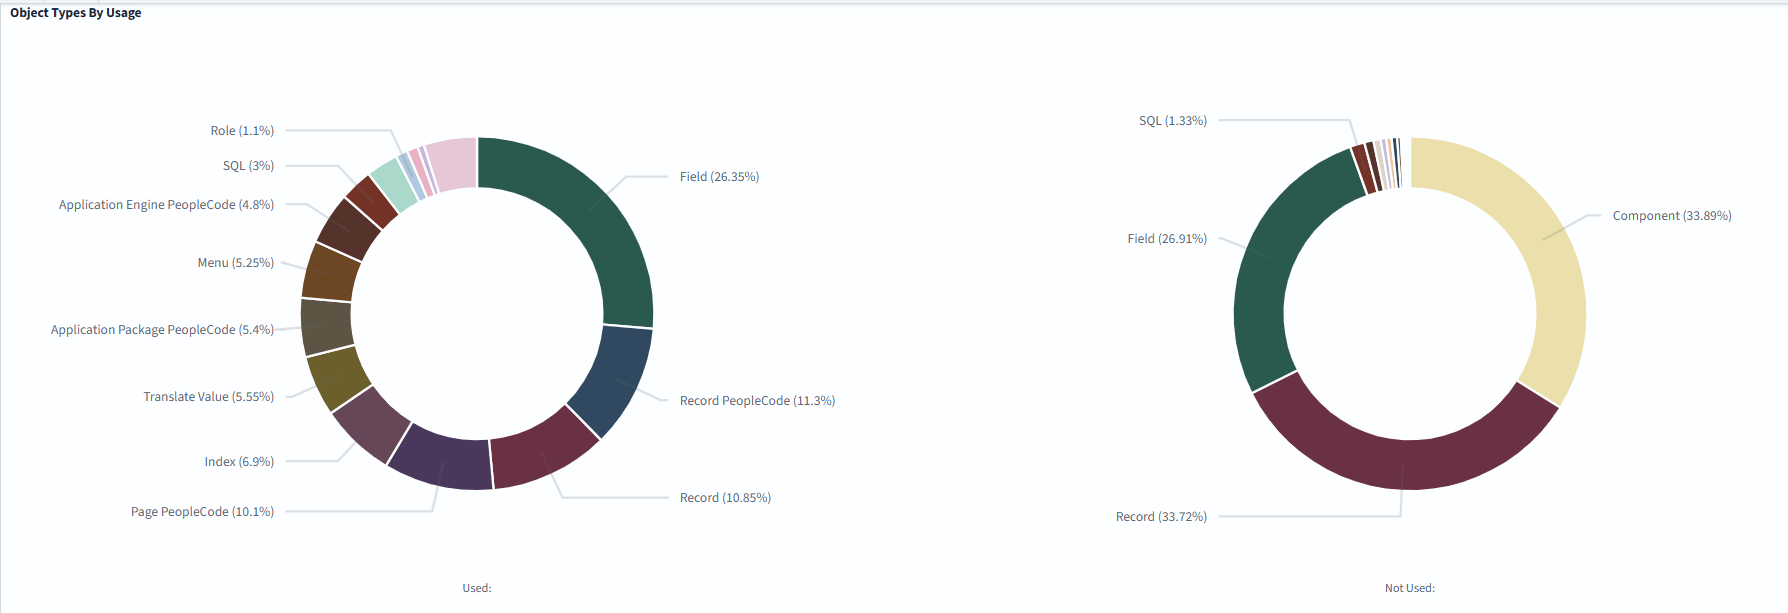
The Used chart displays the breakdown of object types that are currently being used.
The Not Used chart displays object types that are defined in the system but not currently in use.