Analyzing Inventory Using PeopleSoft Insights
This topic displays and explains how to analyze Inventory data using PeopleSoft Insights dashboards.
Use these pages to analyze Inventory using PeopleSoft Insights dashboards.
|
Page Name |
Definition Name |
Usage |
|---|---|---|
|
EP_IN_KIBANA_LOT_NOT_EXPIRED |
View the Item lots approaching expiration date. |
|
|
EP_IN_KIBANA_LOT_EXPIRED |
View expired item lots. |
|
|
EP_IN_PARLOC_INS_FL |
View and analyze the number of par locations, par items, and their distribution across business units. |
|
|
EP_IN_PARCNT_INS_FL |
Monitor par counting events, track completion status, and analyze inventory activities across different locations. |
Use the Item Lots Approaching Expiration Date Dashboard to view the Item lots approaching expiration date.
Navigation:
Select the Item Lots Approaching Expiration Date tile.
This example illustrates the fields and controls on the Item Lots Approaching Expiration Date Dashboard (1 of 2). You can find definitions for the fields and controls later on this page.

This example illustrates the fields and controls on the Item Lots Approaching Expiration Date Dashboard (2 of 2).

Each bar chart displays the top 10 Business Units, Categories, Locations, and so on.
Item Lots Approaching Expiration Date - Data table
This grid displays the summary of all the item lots approaching near expiration date.
|
Field or Control |
Description |
|---|---|
|
Balance by Unit |
Select to access the Item Balance by Unit Page. |
Use the Non-Viable Item Lot Analysis Dashboard to view the expired item lots.
Navigation:
Select the Non-Viable Item Lot Analysis tile.
This example illustrates the fields and controls on the Non-Viable Item Lot Analysis Dashboard (1 of 2). You can find definitions for the fields and controls later on this page.
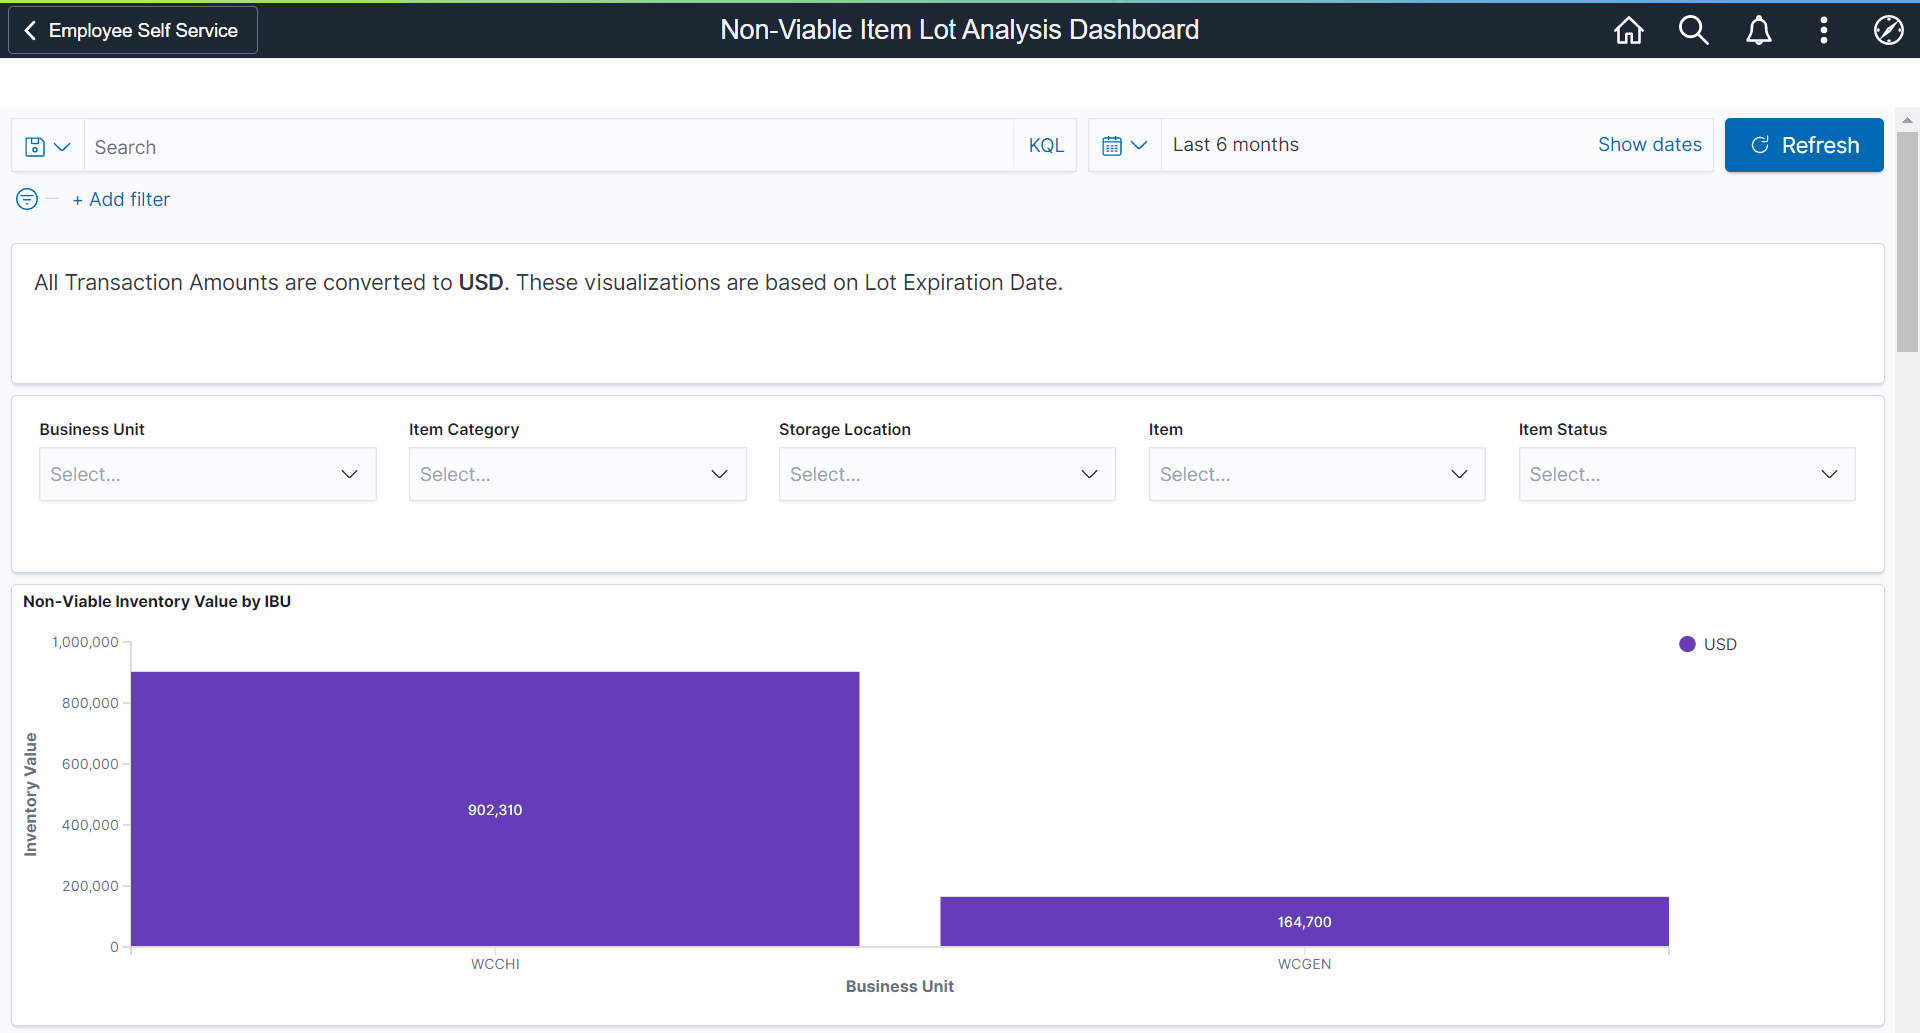
This example illustrates the fields and controls on the Non-Viable Item Lot Analysis Dashboard (2 of 2).

Non-Viable Item Lot Analysis -Data table displays the summary of all the expired item lots.
Select Item Balance by Unit Page to view details.
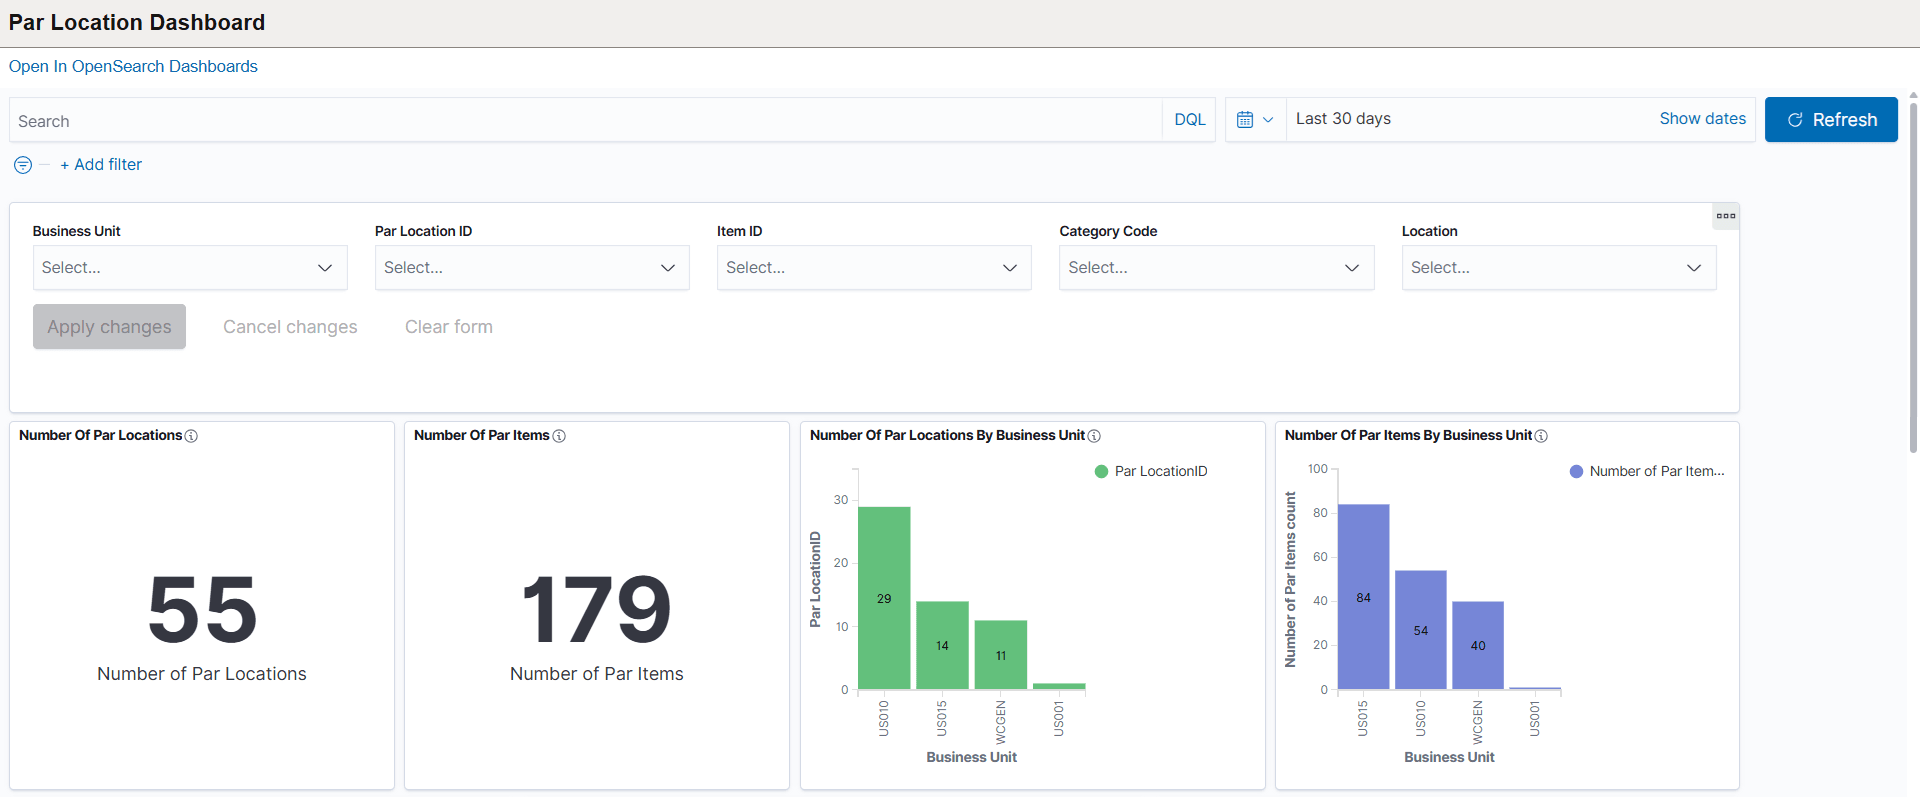
Use the Par Location Dashboard to view and analyze the number of par locations, par items, and their distribution across business units.
This dashboard helps you track replenishment options, identify common par items, and monitor inventory definitions for better operational visibility.
Navigation:
Select the Par Location Dashboard tile.
This example illustrates the fields and controls on the Par Location Dashboard (1 of 3).
This example illustrates the fields and controls on the Par Location Dashboard (2 of 2).
This example illustrates the fields and controls on the Par Location Dashboard (3 of 3).
Use filters on the Par Location Dashboard to narrow results by business unit, par location ID, item ID, category code, and location. By default, the dashboard displays data for the last 30 days. Adjust filter values as needed to view specific data.
Click on any visualization tile in the Par Location Dashboard, the dashboard updates the related data tables and charts to display detailed information specific to the selected value. This allows you to drill down and analyze items, locations, or categories in greater detail for more focused insights.
You can use the "Export To" option to export table data to Excel for further analysis or reporting.
The following visualizations and related data tables are available in the Par Location Dashboard:
Number of Par Locations: Displays the total count of par locations available based on your selected filters. Use this metric to quickly assess how many par locations exist in your organization.
Number of Par Items: Shows the total number of par items defined within the selected filters. This value helps you track the overall inventory items managed across par locations.
Number of Par Locations by Business Unit: Displays the count of par locations for each business unit. Use this visualization to compare how par locations are distributed across different business units.
Number of Par Items by Business Unit: Shows the total number of par items in each business unit. This helps you identify how inventory items are allocated among different business units.
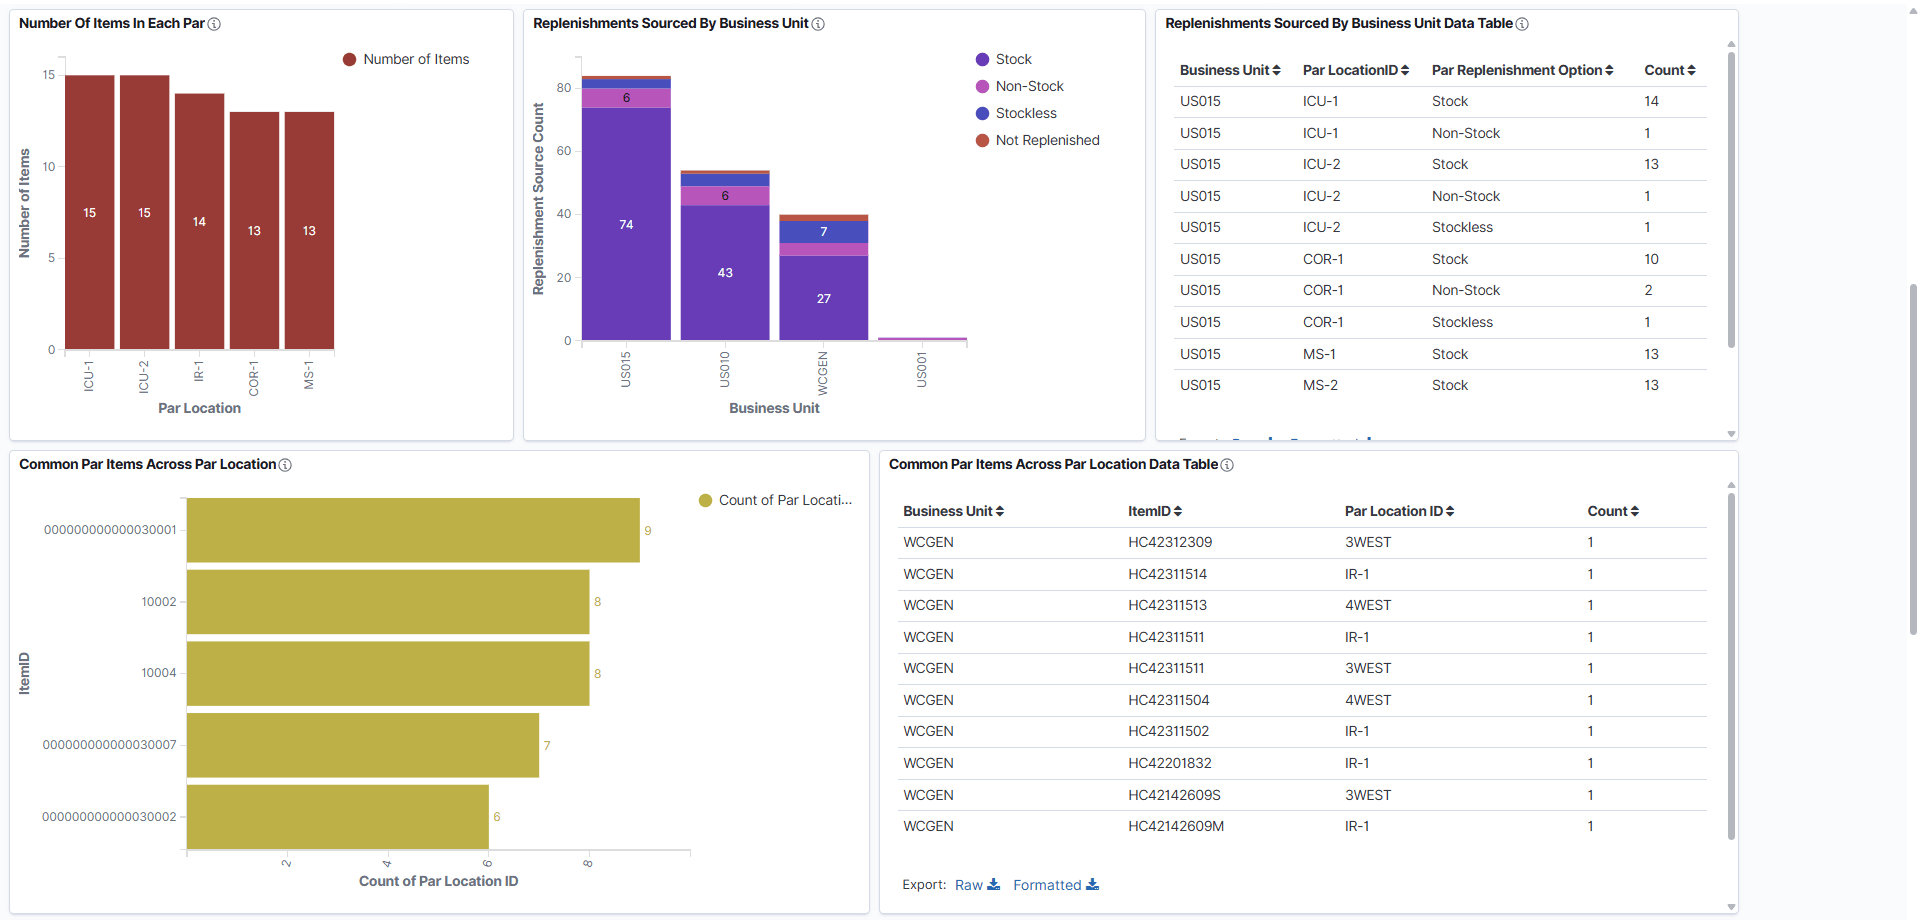
Number of Items in Each Par: Displays the count of items assigned to each par location. Use this to see how inventory items are distributed across different par locations.
Replenishments Sourced by Business Unit and Data Table: Displays the number of replenishments for each business unit, broken down by replenishment option (Stock or Non-Stock). The related data table provides detailed information such as par location ID, item ID, and item count for each replenishment, allowing you to review and analyze sourcing methods in depth.
Common Par Items Across Par Location and Data Table: Shows items that are commonly maintained across multiple par locations and how frequently each item appears. The related data table lists business unit, item ID, par location ID, and item count, giving you a detailed view of widely used inventory items across different locations.
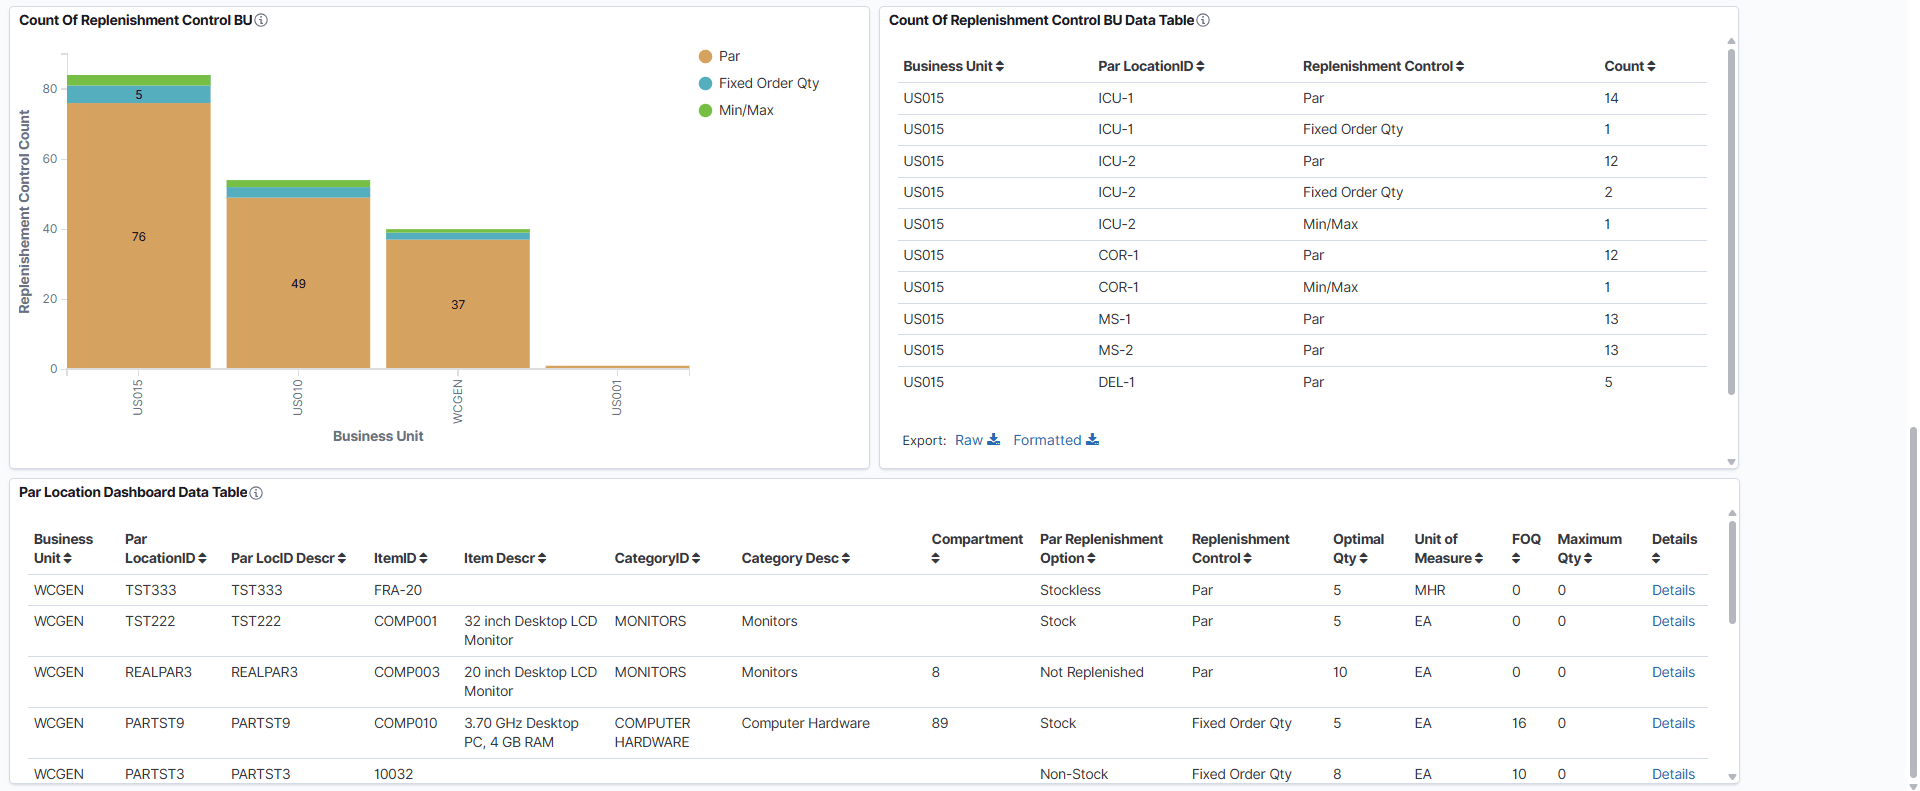
Count of Replenishment Control BU and Data Table: Displays the count of each replenishment control type (such as Par) for every business unit. The related data table provides a detailed breakdown, including business unit, par location ID, replenishment control, and item count, helping you analyze how replenishment controls are distributed across business units.
Par Location Dashboard Data Table: Provides a comprehensive, detailed list of all par locations based on the selected filters. This table includes business unit, par location ID, item details, category, replenishment options, optimal quantity, and other relevant inventory information for easy review and export.
Click the Details link to navigate to the Par Location - Line page to assign items to par locations and determine replenishment options. For more details, refer to the Define Par Location - Line Page.
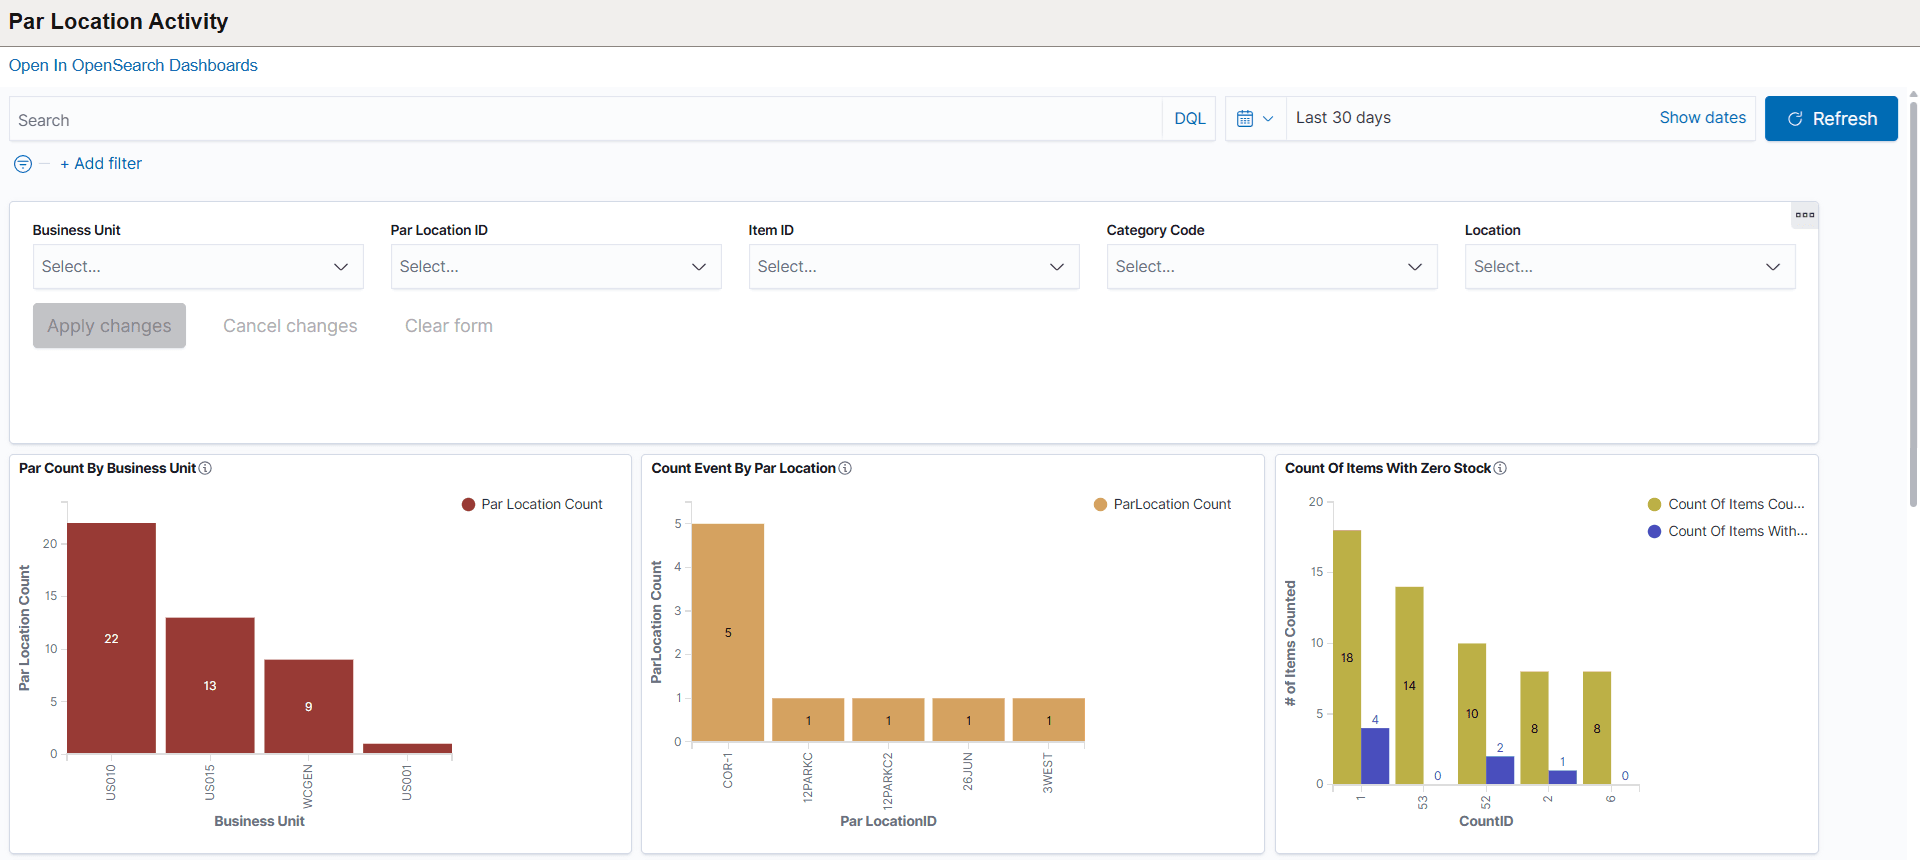
Use the Par Location Activity dashboard to monitor par counting events, track completion status, and analyze inventory activities across different locations.
This dashboard helps you manage inventory counts, identify zero stock items, and review replenishment actions efficiently.
Navigation:
Select the Par Location Activity tile.
This example illustrates the fields and controls on the Par Location Activity (1 of 3).
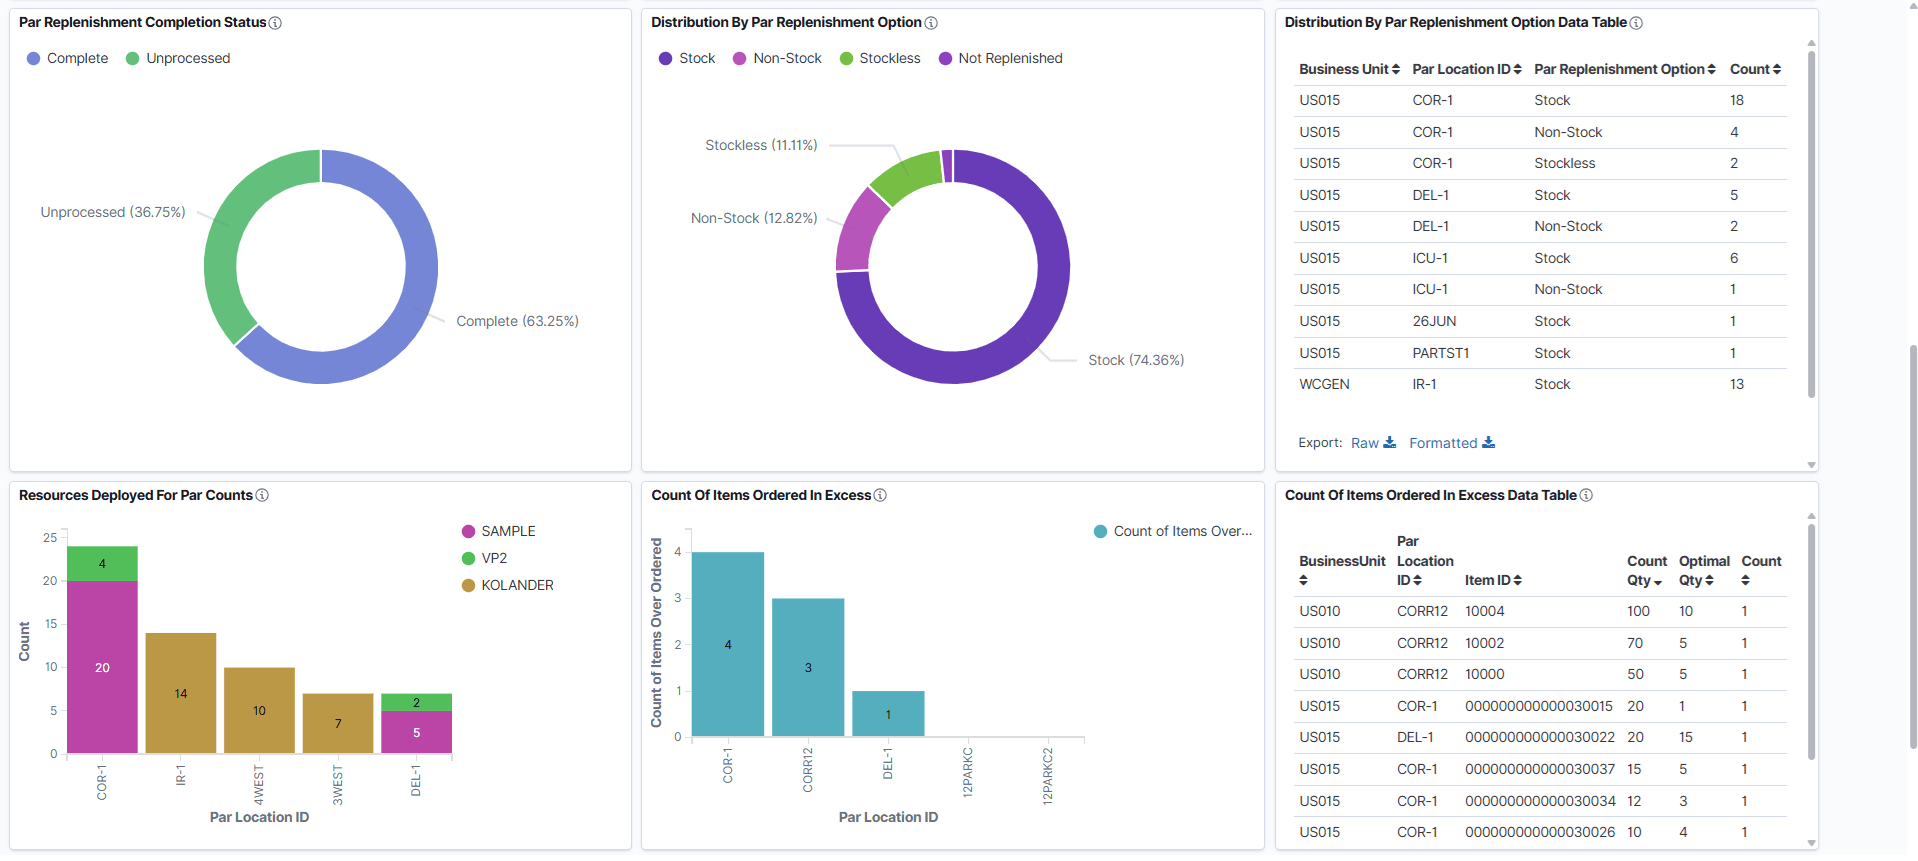
This example illustrates the fields and controls on the Par Location Activity (2 of 3).
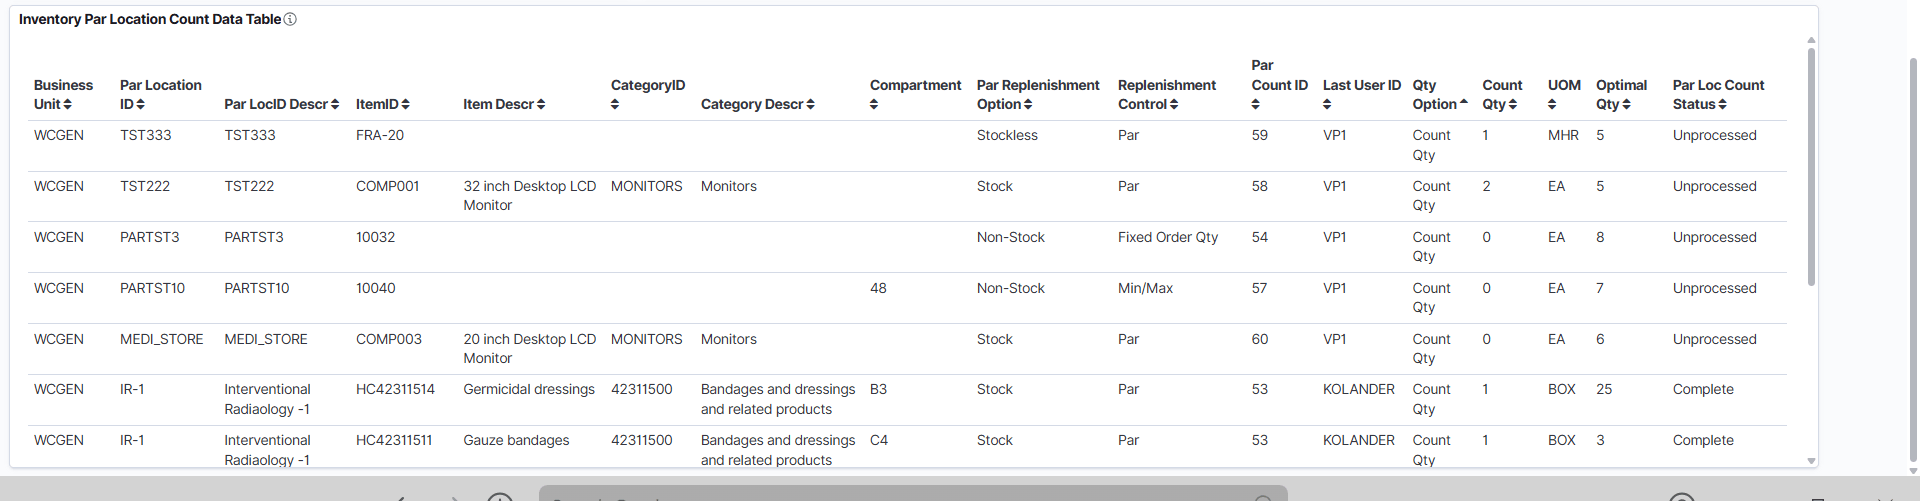
This example illustrates the fields and controls on the Par Location Activity (3 of 3).
The following visualizations and related data tables are available in the Par Location Activity dashboard:
Par Count By Business Unit: Displays the total number of par count events for each business unit. Use this to compare par counting activity across different business units.
Count Event By Par Location: Shows the number of par count events for each par location, helping you monitor inventory counting at each location.
Count Of Items With Zero Stock: Displays the number of items with zero stock at each par location. Use this to identify where stockouts are occurring during inventory counts.
Par Replenishment Completion Status: Shows the completion status of par replenishment, divided into Complete and Unprocessed categories. This helps track the progress and overall completion rate of replenishment cycles.
Distribution By Par Replenishment Option and Data Table: Illustrates the proportion of par items sourced as Stock or Non-Stock within the selected filters. The related data table lists detailed information for each business unit, par location ID, replenishment option, and item count, providing an in-depth view of replenishment sourcing.
Resources Deployed For Par Counts: Displays the number of resources (such as staff or teams) deployed for par counts at each location, helping you evaluate resource allocation.
Count Of Items Ordered In Excess and Data Table: Shows the number of items ordered above their optimal quantity at each par location. The related data table gives details for each business unit, par location, item, excess quantity, and optimal quantity, allowing you to review and address over-ordering.
Inventory Par Location Count Data Table: Provides a comprehensive list of par counts and inventory data per location, including business unit, par location ID, item details, replenishment status, count information, and more for easy analysis and export.