Resource Stacked Histogram
Description
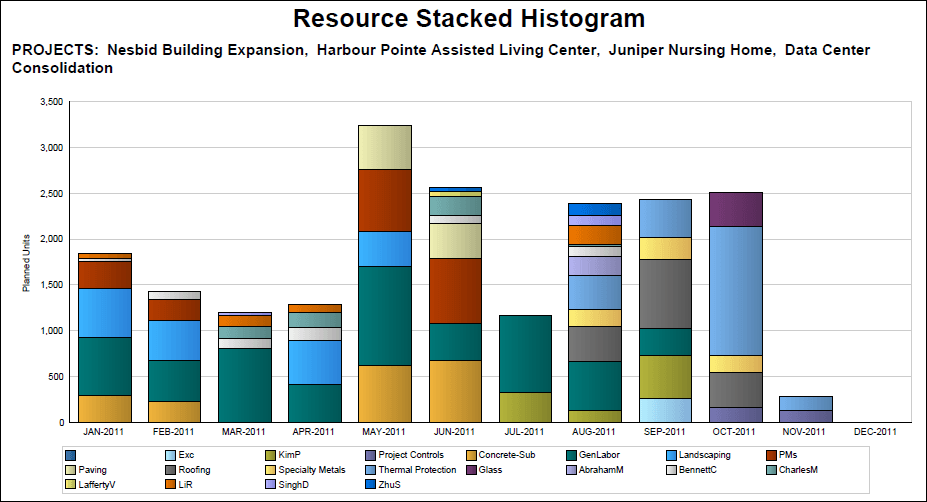
Displays a stacked histogram that shows effort as Planned Units (in hours) for selected resources, stacking bars by resource within the start and end date ranges.
Location
- On the
 Navigation Menu, select
  Reports.
 - Expand the P6Reports folder.
- Expand the Resource folder.
- Click Resource Stacked Histogram.
Last Published Tuesday, March 31, 2026