Investment Alignment Chart
Description
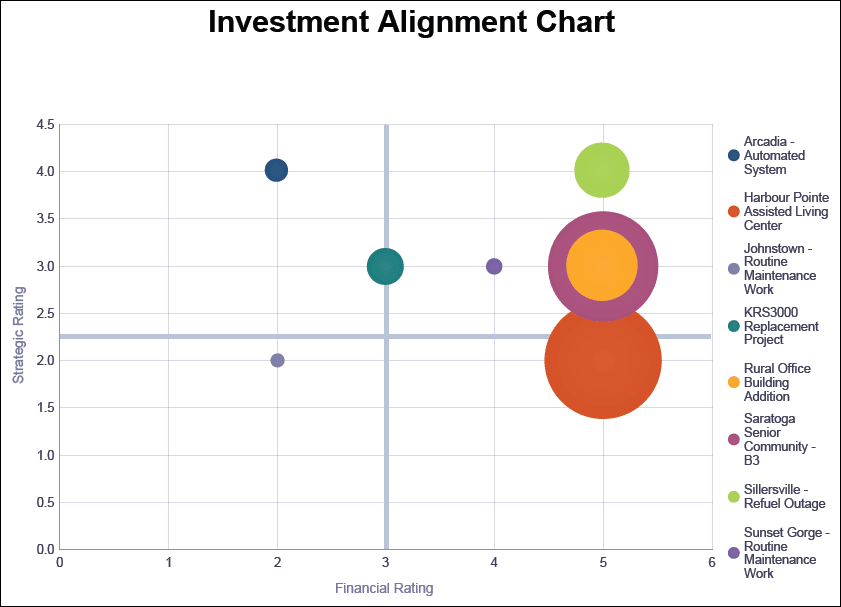
Displays a bubble chart that plots selected projects against their Strategic and Financial Rating with the bubble size representing the At Completion Cost.
Location
- On the
 Navigation Menu, select
  Reports.
 - Expand the P6Reports folder.
- Expand the Portfolio folder.
- Click Investment Alignment Chart.
Last Published Tuesday, March 31, 2026