Limit Line
Description
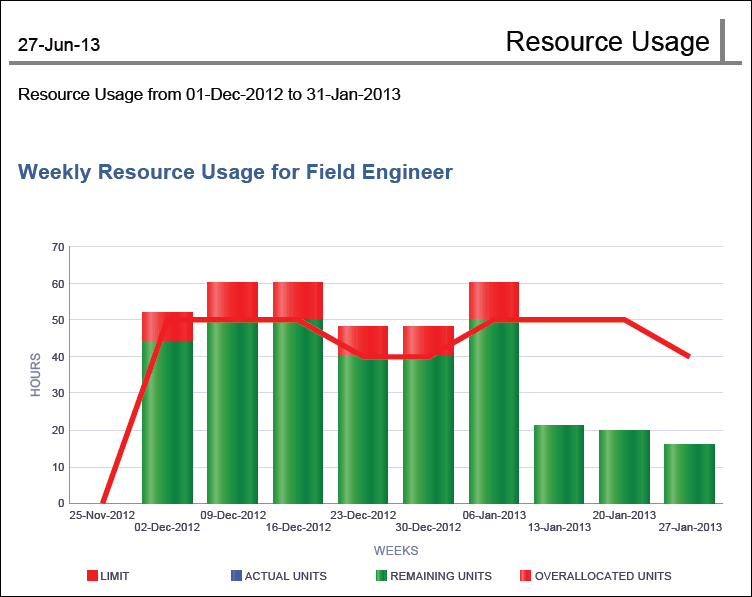
A bar-line graph for each resource showing bars for Actual Units, Remaining Units, and Overallocated Units and a line for the resource's Limit. The y-axis shows hours. The x-axis shows week.
Location
- On the
 Navigation Menu, select
  Reports.
 - Expand the P6Reports folder.
- Expand the Resource folder.
- Click Limit Line.
Last Published Tuesday, March 31, 2026