Viewing the Workforce Survey Analysis Report
Access the Workforce Survey Analysis Report (Marketing, Interactive Reports, Workforce Survey Analysis.)
When you access the Workforce Survey Analysis Report, a configurable search page is displayed, showing the surveys that the user or role can view. Only those users or roles with the Aggregate Reports permission (defined on the Dialog Designer – Team setup page). You must specify a business unit for the search; all other fields are optional.
After the search has completed, you can view one or more surveys (for example, if you wanted to compare a previous year's survey with this year's version. Choose one or more surveys by selecting their Select check boxes, then click theLaunch Survey Analysis Report button to launch the reports. You can also click a dialog name in the result list to launch the report for that survey.
The Workforce Survey Analysis Report contains two tabs:
Workforce Survey Analysis.
By Score Bracket.
Survey Analysis Tab
The Survey Analysis tab shows measures by dimensions other than Score Bracket, assuming that they have been enabled for the user’s role. The default dimension chosen for the user’s role in the Role to Dimension Mapping screen appears by default on the Y axis of the analytic grid.
Image: Survey Analysis tab (1 of 2)
This example illustrates the fields and controls on the Survey Analysis tab (1 of 2). You can find definitions for the fields and controls later on this page.
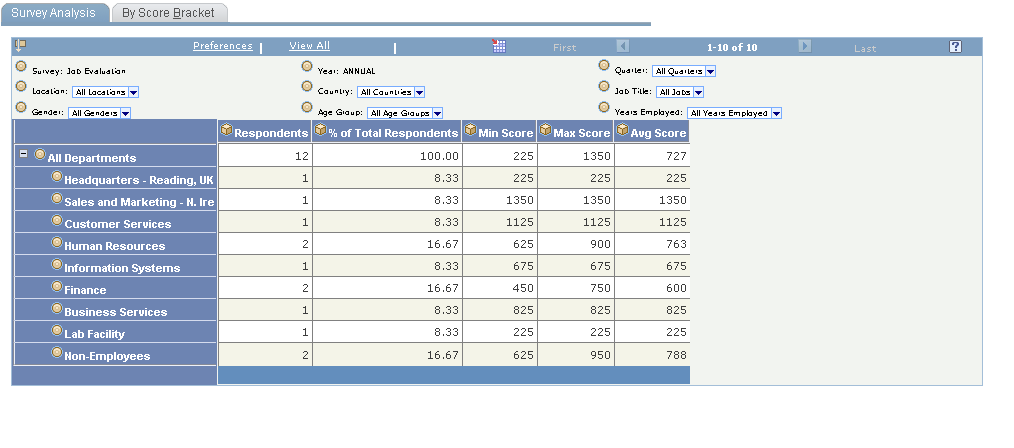
Image: Survey Analysis tab (2 of 2)
This example illustrates the fields and controls on the Survey Analysis tab (2 of 2). You can find definitions for the fields and controls later on this page.
The following data is displayed in the analytic grid:
|
Field or Control |
Definition |
|---|---|
| Filters |
Survey: The selected survey. Year: The year in which the survey falls. Quarter: The quarter in which the survey falls. Other dimensions: The other dimensions that have been enabled for the user's role on the Role to Dimension Mapping setup page, with the exception ofScore Brackets andSurvey Rating. |
| Grid |
The grid's Y axis shows the default dimension chosen on the Role to Dimension Mapping page for the user's role. The X axis shows the measures:
|
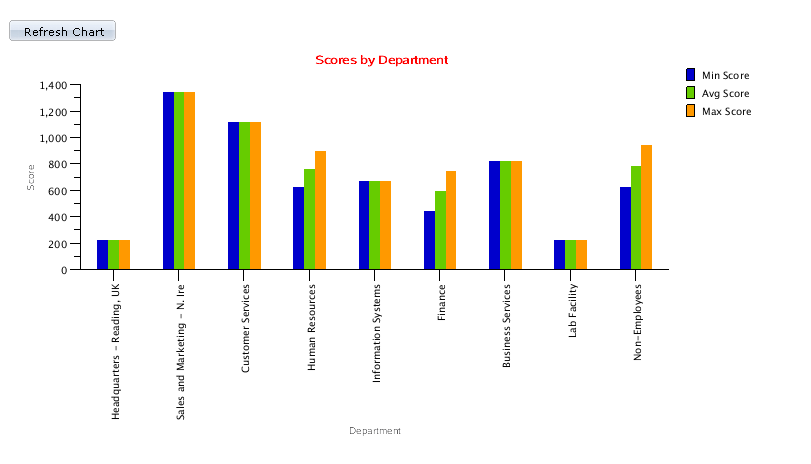
| Refresh Chart |
Click this button to refresh the graphical chart from data in the grid. You should click this button any time the data in the grid changes to ensure that the grid and the chart are displaying the same data. |
| Chart |
This bar chart plots Average, Min, and Max Scores on the Y axis. The X axis of the chart is determined by the Y axis dimension of the grid. If there are multiple dimensions on the grid's Y axis, then the outermost dimension is displayed on the chart's X axis. |
By Score Bracket Tab
This report uses Score Bracket as the default dimension of the Y axis of the analytics grid. All other dimensions enabled for the user’s role are also displayed.
Image: By Score Bracket tab (1 of 2)
This example illustrates the fields and controls on the By Score Bracket tab (1 of 2). You can find definitions for the fields and controls later on this page.
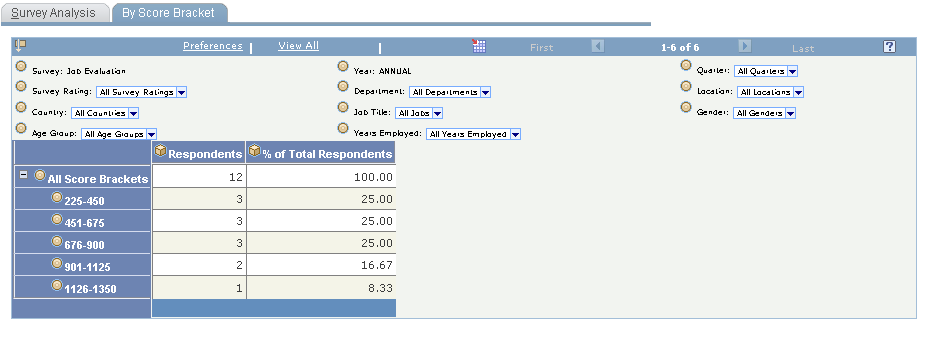
Image: By Score Bracket tab (2 of 2)
This example illustrates the fields and controls on the By Score Bracket tab (2 of 2). You can find definitions for the fields and controls later on this page.
|
Field or Control |
Definition |
|---|---|
| Filters |
Survey: The selected survey. Year: The year in which the survey falls. Quarter: The quarter in which the survey falls. Other dimensions: The other dimensions that have been enabled for the user's role on the Role to Dimension Mapping setup page. |
| Grid |
The grid's Y axis shows the Score Brackets. The X axis shows:
|
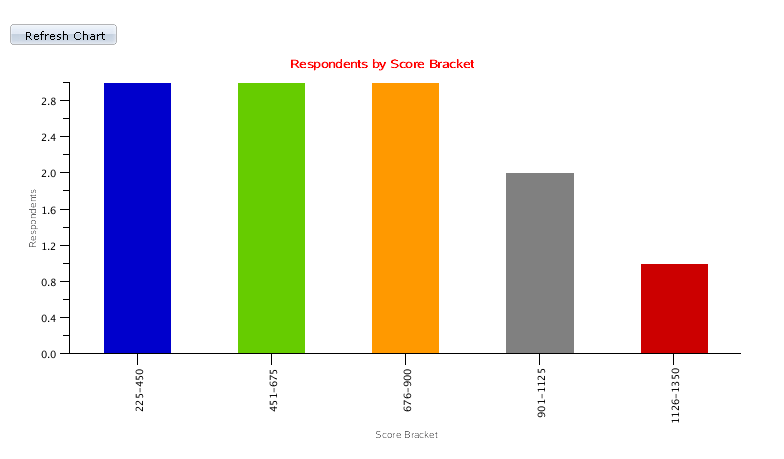
| Refresh Chart |
Click this button to refresh the graphical chart from data in the grid. You should click this button any time the data in the grid changes to ensure that the grid and the chart are displaying the same data. |
| Chart |
This bar chart plots Respondents (# of Respondents) on the Y axis. The X axis is specified by the Y-axis dimension of the analytics grid. If there are multiple dimensions on the Y axis of analytic grid, then the outermost dimension is shown on the chart's X axis. |