35.9 PDU Alerts and Configuration
PDU and Enterprise Manager can be configured to report two kinds of incidents to the user:
-
If current level of a phase of some module in amperes crossed some set warning or alarm threshold.
-
If difference between current level in ampere of phases of PDU module is bigger than the set threshold.
You can set warning and alarm thresholds in both PDU and Enterprise Manager. These settings are independent on each other. Incidents are generated independently from warning and alarm thresholds set in PDU and in Enterprise Manager.
35.9.1 Configuring Alerts in a PDU
Perform the following steps to configure alarm and warning thresholds in a legacy PDU Management Interface:
-
Open the PDU Management Interface in the web browser (See PDU Version Identification).
-
In the PDU User Interface, click Param Configuration.
-
Login with your user name and password.
-
Set alarm and warning current thresholds in amperes, then click Submit.
Note:
Info low is not used for PDU monitoring in Enterprise Manager.
-
Repeat the above steps for all modules.
35.9.2 Configuring Alerts in Enterprise Manager
Perform the following steps to configure alarm and warning thresholds in Enterprise Manager.
-
Open PDU landing page as described in Physical View of the PDU.
-
Click the Target Menu Systems Infrastructure PDU.
-
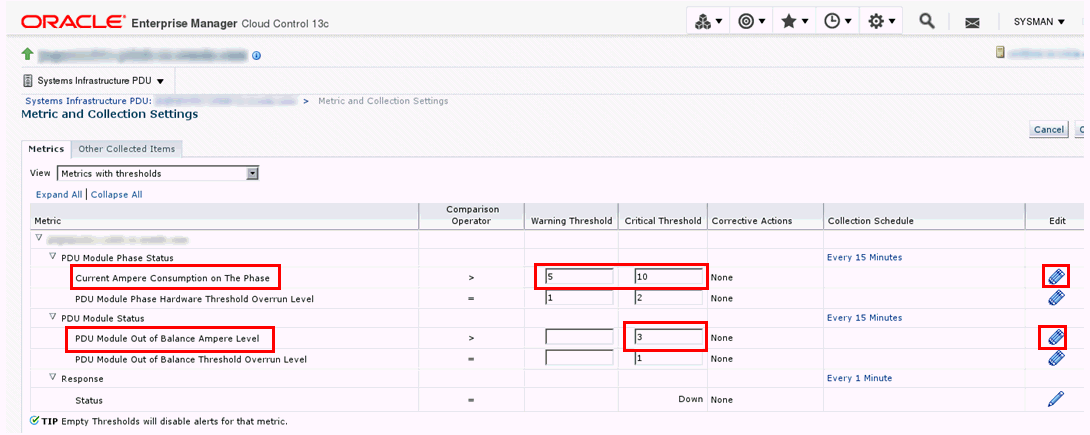
Under Systems Infrastructure PDU, select Monitoring, then click Metric and Collection Settings.
Figure 35-10 Metric and Collection Settings

Description of "Figure 35-10 Metric and Collection Settings" -
In the table, click the Edit icon against Current Ampere Consumption on the Phase and edit the values of Warning Threshold and Critical Threshold.
-
Click the Edit icon against PDU Module out of Balance Ampere Level and edit the value of Critical Threshold.
Note:
Do not change Warning Threshold and Critical Threshold for PDU Module Phase Hardware Threshold Overrun Level and PDU Module out of Balance Threshold Overrun Level. It those values are changed, incidents will not to be generated based on alarm and warning levels set directly in the PDU or they will be generated incorrectly.
If values were already changed, set PDU Module Phase Hardware Threshold Overrun Level Warning Threshold to 1, Critical Threshold to 2, and PDU Module out of Balance Threshold Overrun Level Critical Threshold to 1.
-
Click OK.
35.9.3 Viewing Alert Incidents
To view incidents generated from alarm and warning threshold and identify the incident, click Open Incidents dashlet to view a summary of all the incidents on the PDU. Click a specific incident to view incident details.
-
For example, any incident generated from alarm and warning thresholds set directly in PDU contains the following text:
PDU Module 0, Phase 1 crossed the Module Phase Ampere Level alarm or warning threshold set in PDU Web interface on Parameter page. Module Phase Ampere Level was 2.4 A.
-
For example, any incident generated from alarm and warning thresholds set in the Enterprise Manager contains the following text:
PDU Module 1, Phase 1 crossed the Module Phase Ampere Level alarm 2 A or warning 1 A threshold set by user in monitoring template. Module Phase Ampere Level was 3.2 A.
Incidents are automatically cleared when current level goes under the set alarm and warning levels.
35.9.4 SNMP Traps Forwarding
PDU is by default configured by Enterprise Manager to generate and send traps to IP address where Enterprise Manager monitoring agent and backup reside.
Enterprise Manager can receive these traps and generate Alert Incidents immediately after alert condition is met in PDU.
PDU can send traps only to default SNMP traps port UDP 162 as is defined in SNMP standard. Enterprise Manager agent however listens for SNMP traps on a different port.
Because of this port mismatch, SNMP traps generated by PDU are not delivered to Enterprise Manager by default.
Note:
Metric recollection interval can be changed by user in Enterprise Manager in Target Menu, submenu Metrics, item Metric and Collection Settings.
To deliver PDU SNMP traps from PDU to Enterprise Manager, you have to set port forwarding on hosts where monitoring and backup agents are deployed. Forward UDP port 162 to UDP port where Enterprise Manager agent is listening for SNMP traps.
How to set port forwarding depends on operation system you use on host where agent is deployed. Consult your operating system documentation on how to set UDP port forwarding.
Note:
Do not use Linux tool snmptrapd to forward traps. The traps from snmptrapd do not contain IP of the originating PDU, but of the snmptrapd forwarder. Enterprise Manager uses PDU IP address to couple received SNMP trap with monitored PDU. If received SNMP trap has wrong originator IP address, it is thrown away by Enterprise Manager and not considered any more.To find the port where PDU monitoring and backup agent listen for SNMP traps you can:
-
Get the port from EMD_URL property in the AGENT_INST/sysman/config/emd.properties file on hosts where primary and monitoring agents are deployed. (This is the port at which agent will listen over UDP for traps).
-
Open All Targets page in the Enterprise Manager UI and find monitoring and backup agent in the targets list. Number in the agent name after colon (:) is the UDP port which the agent will listen for SNMP traps.