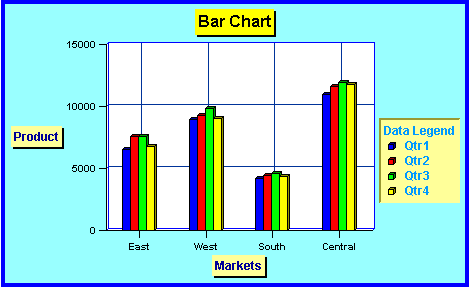
A bar chart can display as many as 50 data sets, with any number of values assigned to each data set. Properties for the following items are supported for the bar chart:
You can display data sets by grouping corresponding bars or stacking them, or you can display them in separate rows. You can show bars with or without a 3D effect, applying one of the following bar shapes: bar, triangle bar, diamond bar, or cylinder.
The following example shows four data sets - East, West, South, and Central - with four values assigned to each data set. The bars are grouped and displayed with a 3D effect.
