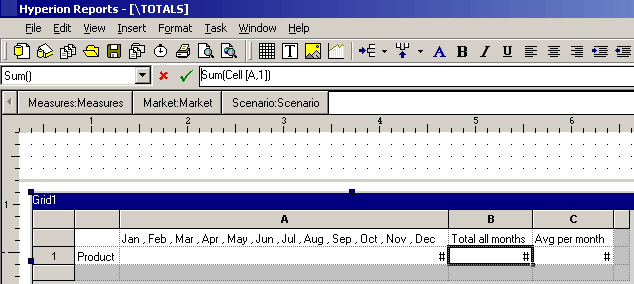
You can use the formula bar to create formulas that total data, average data, or perform other functions of your choosing. When creating formulas for rows that summarize data for the year, for example, you use the formula bar to select the functions and dimensions that return your result. The following example illustrates this information:

An average amount per month, calculated using the Avg function
Use custom headings to create titles for the Total and Average columns. This is described in Building Reports.
To create this example, you would create a grid in the designer with Product on the rows and Year on the columns. Double-click Year to bring up member selection. Place all twelve months in the selected pane and remove Year. Click OK.
After you select the members, insert two formula columns: one for the annual total and another for the average monthly amount.
In our example, the first formula column that falls outside the months of the Year member contains a Sum function. This function adds the figures for each month. Since all months are defined in one cell only, the reference is to that cell location. The formula is built in the formula bar:
The second formula column calculates the average of the months for the Year member. Because there are 12 months in a year, the Avg function adds all monthly totals and divides the total by 12. The formula is:
In general, there are two ways to specify a data formula in a grid, a row/column formula, or a cell formula:
Row/Column - apply one formula to the entire row or column, relative to each cell in that row or column. You define a formula by clicking on the formula row or column header to highlight the entire row or column, then entering the formula in the formula bar. There are some performance benefits when applying row/column formulas.
Cell - apply a formula only to cells in a formula row or column. You define a formula by clicking on the cell, selecting Use a Custom Formula from the properties sheet, and entering the formula in the formula bar. Also, if the cell intersects a formula row and formula column, you can select to use the row formula or the column formula as the cell formula. For more information, see Calculating at the Cell Level.
Therefore, if a formula repeats for each cell in a row or column, use a row/column formula. If different formulas are performed on each cell, use a cell formula.
 To access the