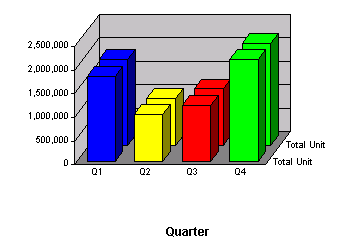
Cluster bar charts can be used to juxtapose categories in one label item category. For example, use clustered bars to compare stores of different types. Clustered bars can also be used to compare two different value items, such as Amount of Sales and Unit sold.
You can change your chart perspective so that the z axis data extended in the third dimension is shown as clusters displayed in the foreground. This charting type is useful when z axis bars are hard to distinguish in standard bar formats.
Cluster charts can be used to juxtapose categories in one label item. For example, use clustered bars to compare stores of different types. Alternatively, cluster bars can also be used to compare two different value items, such as Amount of Sales and Unit Sold.
Clustered bar charts are only displayed in a vertical format.
