Using the scratchpad
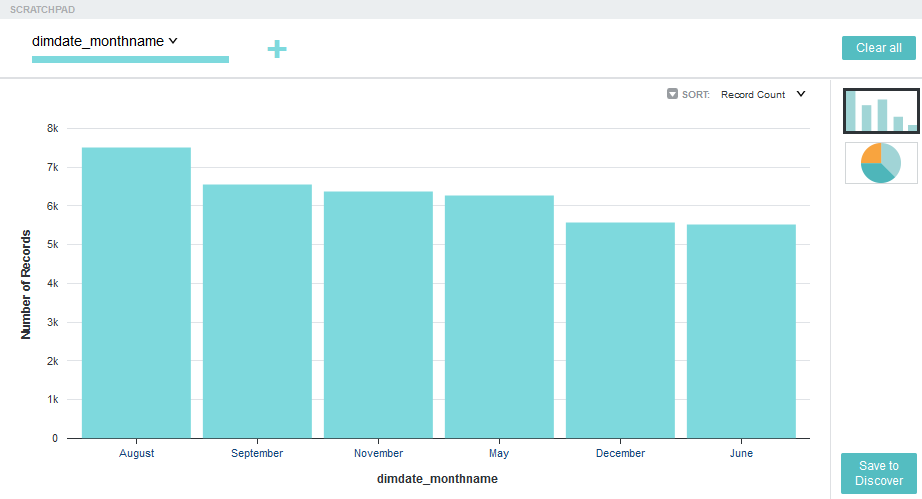
You can use the scratchpad component on the Explore page to try out different visualizations with one or more attributes before adding them to a Discover page.
About the scratchpad
- The scratchpad drop zone, which lists the attributes currently displayed on the scratchpad
- The scratchpad visualizations

The visualizations available in the scratchpad can include charts, box plots, histograms, and maps. These function similarly to the chart components; for information, see Charts.
The type and number of visualizations available for an attribute or combination of attributes varies. If the scratchpad contains only one attribute, it displays the same visualization as the attribute's tile and allows you to switch to the other visualizations available in the attribute's details panel. If the scratchpad contains multiple attributes, it displays the most appropriate visualization for the current set.
Note:
The scratchpad cannot display more than 1000 marks in a visualization. Refine your filtering criteria if you exceed this limit. Some combinations of attributes are incompatible and cannot be displayed by the scratchpad at all.You can page through the available visualizations by clicking the arrows on either side of the scratchpad. You can also display a specific visualization by clicking its thumbnail next to the scratchpad.
Displaying and hiding the scratchpad
The scratchpad displays when you add an attribute to it, or when you click the Show Scratchpad icon at the top right of the Explore page.
To hide the scratchpad, click either the Hide Scratchpad icon or the white arrow at the bottom of the scratchpad.
Adding attributes
- Hover your mouse over an attribute tile and click Add to scratchpad.
- Click the down arrow on an attribute tile to open its details panel and click Add to scratchpad.
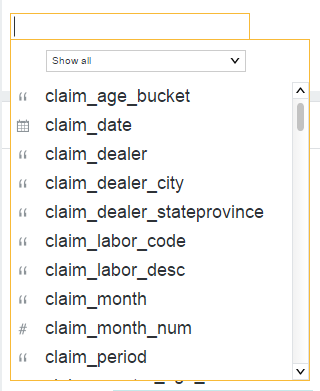
- Click anywhere within the scratchpad drop zone and either enter the name of the attribute you want to add or select it from the list of available attributes.

As you add attributes to the scratchpad, the other attributes may be sorted to put the most relevant first.
Configuring visualizations
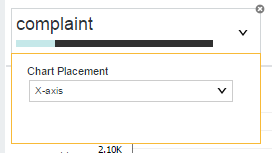
Each type of visualization is configurable; for example, you can change the chart placement and sort order of a histogram plot. To view options for configuring the visualization, click the down arrow next to the attribute's name in the scratchpad drop zone.

You can swap attributes between zones in a visualization by dragging and dropping them on top of each other in the drop zone. Attempting to drag and drop attributes shows a preview icon that indicates whether values are swapped or dropped upon completion. For example, you can re-order inner and outer rings in a Sunburst chart. Dragging and dropping attributes preserves any configured sort or aggregation behavior unless swapping a dimension (non-countable values, such as Strings) with a metric.
You can also modify the sort order using the Sort arrow, when available.
Refining visualizations
Any refinements applied to your project are automatically applied to visualizations within the scratchpad. You can also click on specific values within the visualization to set them as refinements.
You can modify and remove your selected refinements using the Selected Refinements panel. For more information, see Managing Selected Refinements.
Removing attributes
To remove an individual attribute from the scratchpad, hover your mouse over its name in the drop zone and click the delete icon.
To remove all currently selected attributes, click Clear all in the top right of the scratchpad.
Saving a visualization to a Discover page
If you are working within a project, you can save your visualization to a Discover page when you are satisfied with it.
Note:
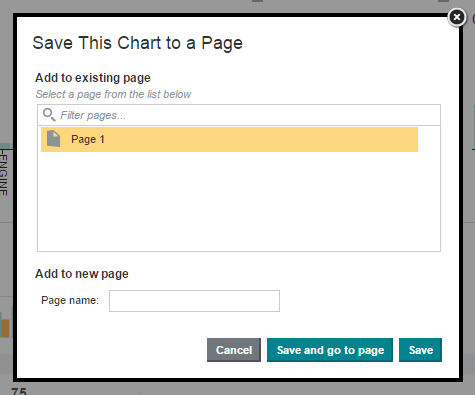
Saving a visualization to a project page causes the project to open to the Discover page instead of the Explore page. If you are not working within a project, you must create one before saving your visualization.To save a visualization to a Discover page, click Save to Discover page, then either select an existing page to save it to, or provide a name for a new page.
