Creating a Custom Visualization Component

You create a component by coding a JavaScript file that uses the Custom Visualization Component JavaScript API to initiate queries and render the returned data to the component. You upload the file as part of the component configuration. Also you write one or more EQL statements to provide the result set for the component.

Before performing this task, you should code the JavaScript file for the custom component to conform to the Custom Visualization Component JavaScript API. You upload the file in the steps below. For details about coding the JavaScript file, see the Custom Visualization Component JavaScript API Reference.

When a business user creates a custom component on a project page in Discover, Studio loads the JavaScript code to render the component.

The JavaScript code has two major requirements:

  • It must extend Oracle.BDD.Portlets.Visualization.Renderers.BaseRenderer.
  • It must implement the init() function. This is executed on each Discover page load and it typically queries for a result set and directs the responds in the component.

To create a Custom Visualization Component:
  1. In the Studio header, click the Configuration Options icon and select Control Panel > Custom Visualizations.
  2. Click + Component.
  3. Specify a name for the component.
    This is the display name of the component as it displays on the Component menu of the Discover page.
  4. Optionally, click Browse to locate an icon image for the component and then click Upload and Ok.
    This is the icon image for the component as it displays on the Component menu of the Discover page.
  5. In JavaScript File, click Browse to locate the JavaScript file that implements your Custom Visualization Component and click Open.
  6. In Renderer class, specify the fully qualified name of the JavaScript class that renders the component.
    For example, in the following JavaScript snippet, the name of the renderer class is Oracle.BDD.Portlets.Visualization.Renderers.DonutPieChart:
    Oracle.BDD.Portlets.Visualization.Renderers.DonutPieChart = Oracle.BDD.Portlets.Visualization.Renderers.BaseRenderer.extend({
    
        init: function() {
                    
            /**
             * Get the queryConfig for the initial query
             */
            var queryConfig = this.getQueryConfig("eql");
    ...
    
  7. Select a Sort type of one of the following:
    • None - Specifies that there is no sort option available for the business user to configure in the component.
    • Defined - Specifies that the sort option for the component is defined by token replacement in an EQL statement. A business user then sorts by value of the token in either an ascending or descending order.
    • Per Dimension - Specifies that a sort option is available for any token defined as a dimension.
  8. Optionally, expand Advanced Options and specify the following:
    • CSS - Specifies visualization-specific CSS. Also note that the CSS is scoped to the visualization's DOM container.
    • External CSS - Specifies a list of URLs to external CSS files. Each URL should be line separated.
    • External JavaScript - Specifies a list of URLs to external JavaScript files. Each URL should be line separated. These JavaScript files might provide additional resources, such as third-party plug-ins, to support the JavaScript file.
    For example:
    https://cdnjs.cloudflare.com/ajax/libs/EventEmitter/4.2.11/EventEmitter.min.js
    https://cdnjs.cloudflare.com/ajax/libs/UAParser.js/0.7.9/ua-parser.min.js
    
  9. Click Next.
  10. In EQL query name, specify the name of the EQL query used in the JavaScript API function getQueryConfig.
    For example, if your Javascript file contains:
    var queryConfig = this.getQueryConfig("eql");
    
    ...
    
    then the EQL query name you specify is eql.
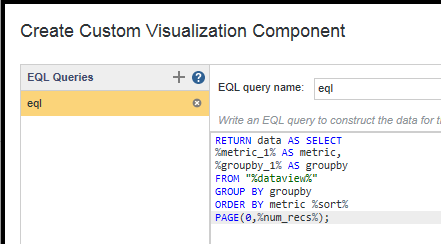
  11. Specify the EQL query for your component in the text box.
    For example:
    Shows an example EQL statement in the editor.

    For more details about writing EQL statements, see the EQL Reference.
  12. Optionally, you can add more EQL queries to the component by clicking + and specifying a new name and EQL query in the text box.
    Each query that you add generates an additional result set for the component to use.
  13. Click Detect Tokens.

    Studio examines the tokens in the EQL query, and based on the syntax of how the tokens are used, Studio adds the tokens to Attributes, Views, Data, and Sort categories. For example, tokens in a FROM clause appear in Views. Tokens in a WHERE clause appear in Data.

  14. If any of the tokens are incorrectly categorized, click the token and drag and drop it into the correct Attributes, Views, Data, or Sort category.
  15. Click each token name and specify the details of how the token is used in the component.
    This steps configures how a business user interacts with the token values on the Discover page. You specify whether a token is a metric or a dimension, its display name, its data view, its data type, and aggregation type.
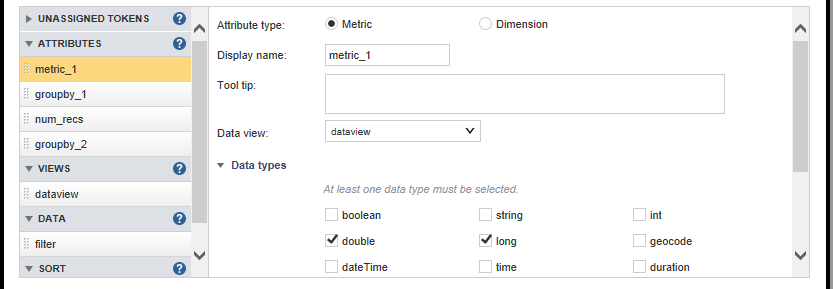
    For example, the settings shown here configure the metric_1 token:
    Shows a single metric with it's display name and data types configured.

  16. Click Save.
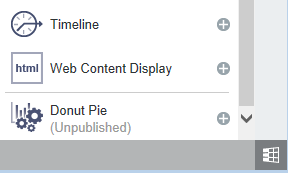
The new component is available at the bottom of the Add Component menu on the Discover page. For example, here is the Donut Pie example used in the procedures:
Shows the Add Component menu with a new addition for the Donut Pie visualization.

The component is not available to business users until you publish it.

Before publishing, you should test the component by working with it as a business user would and adjusting the JavaScript or other configuration if necessary to modify the component's behavior. Once the component works correctly, you publish it for use by other Studio users.