Accessing dashboards
To access a dashboard:
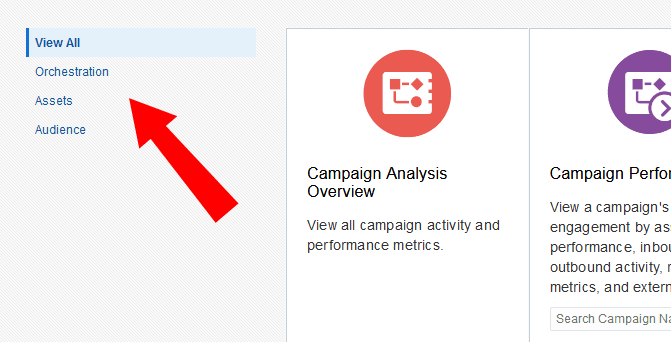
- Navigate to Analytics
 , then click Dashboards.
 - Click the dashboard you want to view.
Tip: Use the filter to view specific dashboard types.
After you open a dashboard, have a look around try out some of the interactive features. Here are some of the interactions that are available on a dashboard.
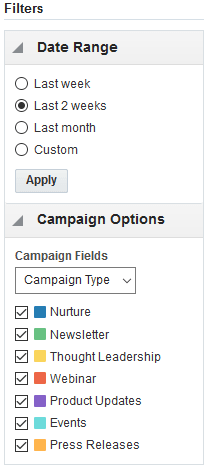
- To filter the dashboard, use the Filter results section.
Note: Any changes you make are not saved.
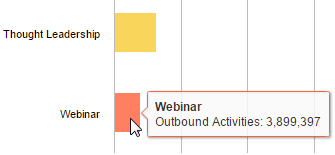
- To view more information about a chart's data, hover over the chart.
- To zoom into a chart, move your mouse over an area and drag the cursor. To reset the view, click Reset Zoom.

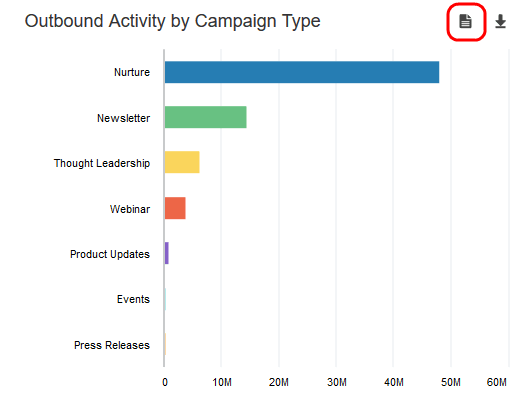
- To download a chart, click
 .
.
- To access the report in Insight, click
 .
. 
Note: This feature is not available from all dashboards.