The Involver Analytics tab is the best place to understand the performance of your campaigns and export analytics data.
Watch a quick demo of our analytics experience below:
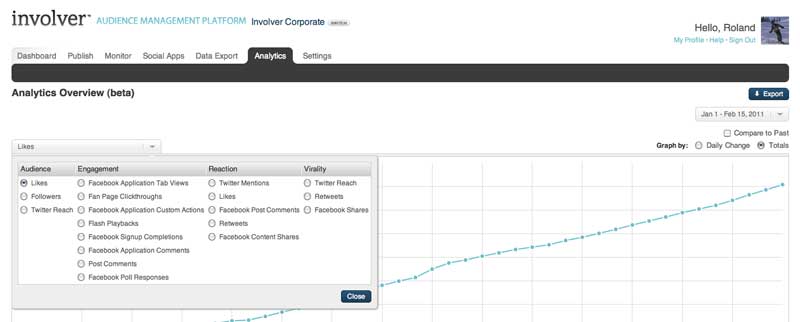
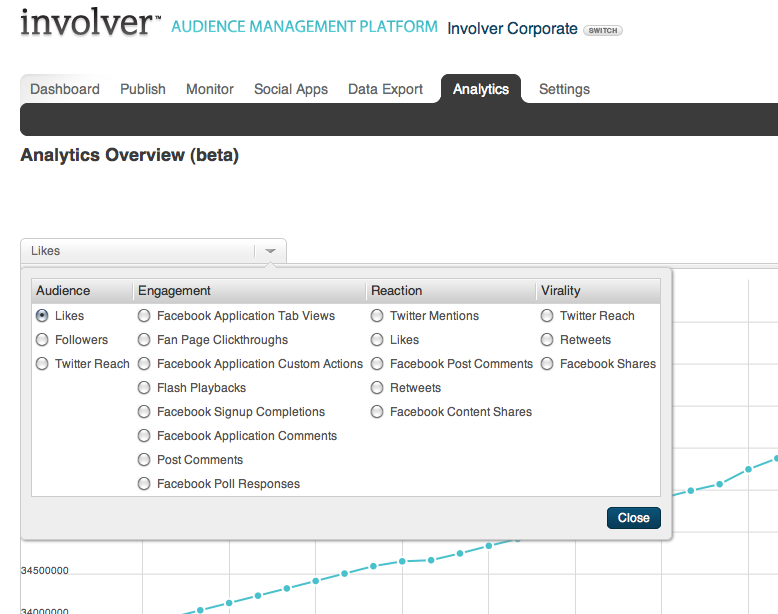
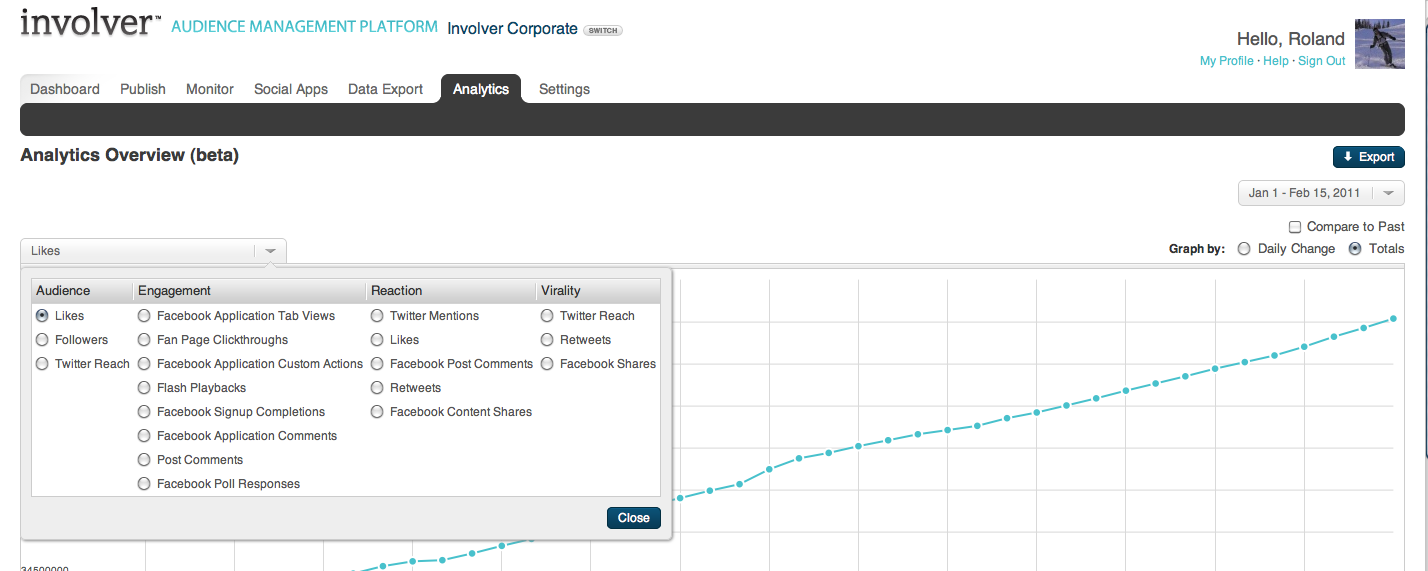
The analytics tab allows users to view a selection of metrics which are grouped by category.
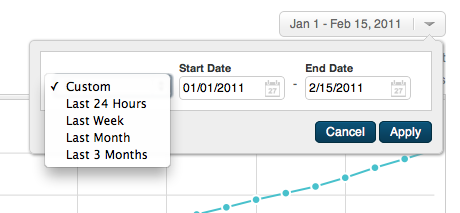
Set date range: The date range selector is located at the top right of the analytics tab and has two modes including, preset ranges and custom ranges.
Preset ranges: Preset ranges let you quickly jump to one of the four present ranges.
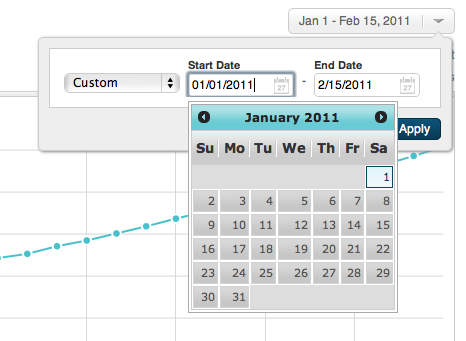
Custom date range: The custom date range settings allow users to specify the exact range they are interested in by using a calendar selector.
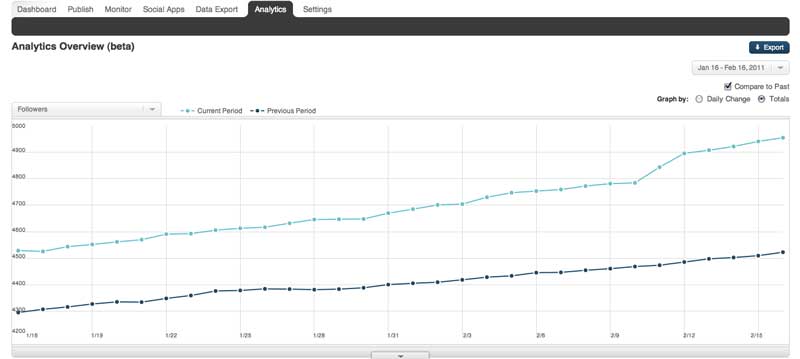
Compare to past mode: The "compare to past" checkbox in the top left of the tab sits just under the date selector and allows the user to graph data from the data range selected and compare it to the same period in the past. Thus, if the date selection is set to the current week, the graph will present the current week's data along with the previous week.
Daily change: The Daily change mode allows you to see the daily change of your metric rather than the total value. This mode can be used concurrently with the compare to past mode. 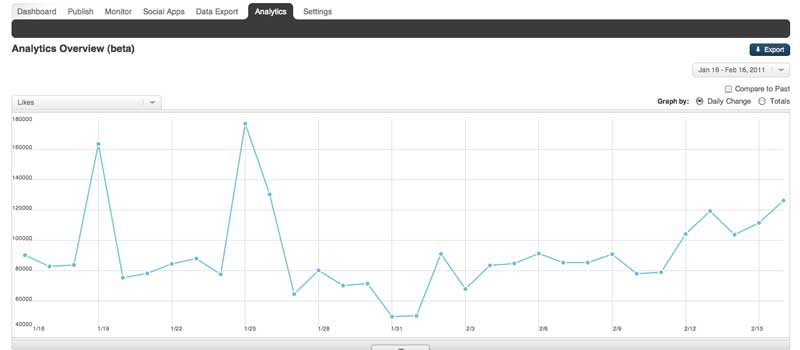
Drill drown drawer: On the bottom edge of the main graphing area there is a button that opens up a drill down drawer. This drawer contains more detailed information about the metric that is being shown in the main graph area. In the image below Twitter followers are being graphed and the drill down drawer shows there Twitter accounts that make up the total values.
*Compare to total: Clicking on a selection in this window with graph that specific item and compare it to the total of all items shown in the drill down drawer. 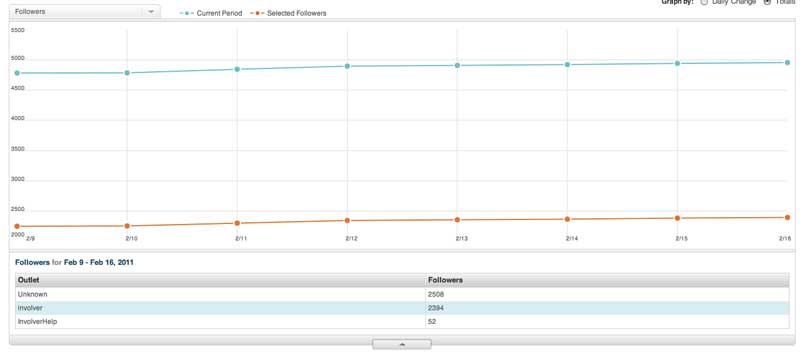
Quick Links: At the bottom of the analytics tab there is a selection of metrics which are grouped and include spark-lines that provide a glimpse into the data for the selected date range. Clicking on one of these spark-lines will load that metrics into the main graph at the top of the page as well as selecting that metric in the metric selection drop-down menu at the top left of the graph. 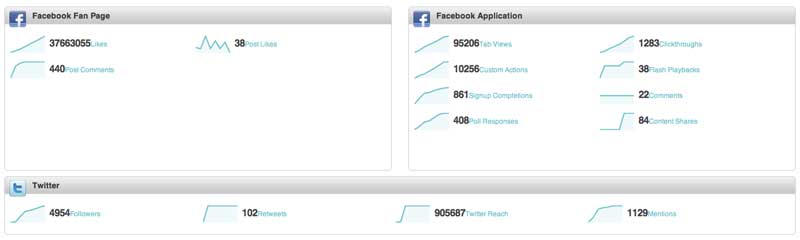
Exporting data: Exporting data from the analytics tab is simple and is based on the date range selected. Simply click on the "export" button in the top left of the tab to download a .csv file of the data your are currently viewing. 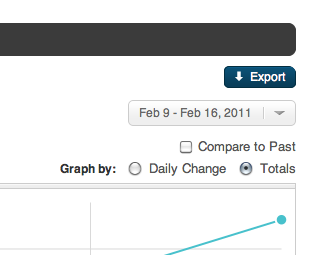
Have questions? Visit our Support Site to browse our Knowledge Base for specific Analytics use cases, or submit a support request for any unexpected behavior. Our Support Team is happy to help!