7 Working with Reports
Oracle Communications Unified Inventory Management (UIM) supports Oracle Business Intelligence Publisher (BI Publisher), which is the reporting standard for UIM. Through a downloadable patch, UIM provides sample reports that you can run in BI Publisher.
Installing and Configuring BI Publisher
The following sections provide information on installing and configuring BI Publisher.
This chapter assumes you are familiar with BI Publisher and its documentation, which is available on the Oracle documentation website:
http://docs.oracle.com/middleware/12212/bip/index.html
Installing BI Publisher
BI Publisher is not part of UIM Installer. To use BI Publisher for UIM reporting, you must install it manually. See the discussion about system requirements in UIM Installation Guide for information about which versions of BI Publisher work with this release of UIM.
BI Publisher is installed as part of Oracle Business Intelligence. So, to install BI Publisher, install Business Intelligence by following the instructions in Installing and Configuring Oracle Business Intelligence, located here:
https://docs.oracle.com/middleware/12212/lcm/BIEIG/BIEIG.pdf
Configuring BI Publisher
After you have successfully installed BI Publisher, you need to configure BI Publisher by performing the tasks described in this section.
Getting Started
To get started with configuring BI Publisher, do the following:
-
Start the BI Publisher WebLogic server by following the instructions in Fusion Middleware User's Guide for Oracle Business Intelligence Publisher, located here:
-
Ensure you have privileges to log in to BI Publisher as an administrator.
Adding a Data Source and Establishing a Database Connection
To run reports against UIM data using BI Publisher, you must add UIM as a data source to BI Publisher and establish a database connection to UIM.
To add a data source and establish a database connection:
-
Log in to BI Publisher as an Administrator.
-
Follow the instructions for creating data sources in Chapter 9 of the Fusion Middleware Administrator's Guide for Oracle Business Intelligence Publisher, located here:
Adding Users
To provide users with view access, BI Publisher offers several security options to provide access.
To add a user and a role, and assign the role to the user:
-
Log into BI Publisher as Administrator.
-
Determine the security model option to use from the administrator's overview. Follow the instructions for granting permissions in Fusion Middleware Administrator's Guide for Oracle Business Intelligence Publisher, located here:
Downloading and Installing the Sample Reports
This section provides information on downloading and installing the UIM sample reports, which are described later in this chapter.
Downloading the Sample Reports
The UIM sample reports are delivered in a separate ZIP file (BIPubReports.zip), which you can download from the UIM software on the Oracle Software Delivery Cloud:
Installing the Sample Reports
You can install the sample reports by using one of the following methods:
Copying the ZIP file to the BI Publisher Repository
To install the sample reports by copying the ZIP file to the BI Publisher Repository:
-
If you have not already done so, download the sample reports.
See "Downloading the Sample Reports" for more information.
-
Open the tempDir/BIPubReports.zip file.
-
Extract the BIPubReports folder to the BIPublisher_HOME/repository/Reports directory.
-
Log in to BI Publisher.
-
In the upper right corner of the Home page, click the Catalog link.
The Catalog appears.
-
Expand Shared Folders, and select the BIPubReports folder.
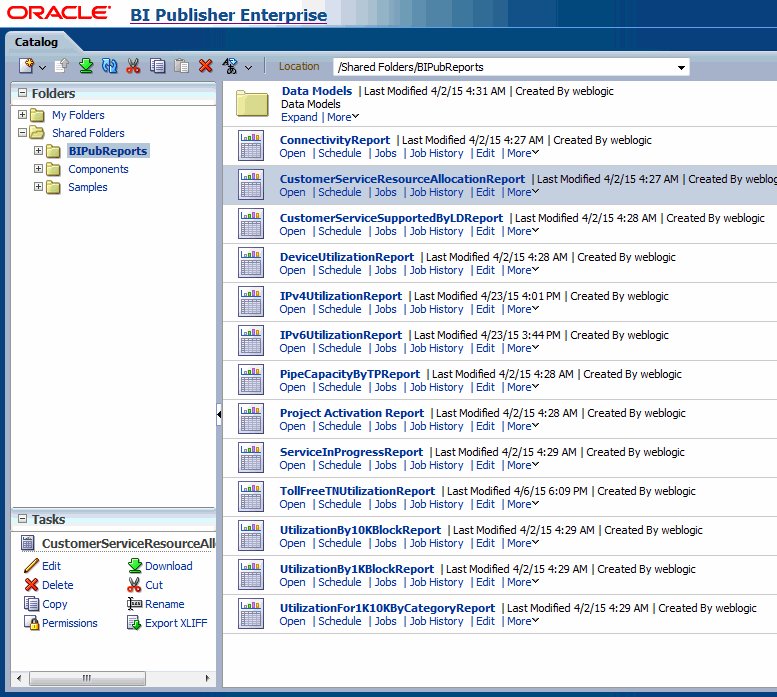
The sample reports are located in the BIPubReports folder, as shown in Figure 7-1.
-
Change the data model file to point it to the data source you created earlier.
See "Changing the Data Model Source" for instructions.
Note:
Regarding the BI Publisher Catalog, files in Shared Folders are accessible to other users, while files in My Folder are user-specific and are not accessible to other users.Uploading the Sample Reports from within BI Publisher
To install the sample reports by uploading them from within BI Publisher:
-
Log in to BI Publisher.
-
In the upper right corner of the Home page, click the Catalog link.
The Catalog appears.
-
Select Shared Folder.
-
Create a new folder named BIPubReports under Shared Folder.
-
Select the BIPubReports folder.
-
Create a new folder named Data Models under BIPubReports.
-
Select the BIPubReports folder.
-
Click the Upload Resource icon.
The Upload dialog box appears.
-
Click Browse.
The Choose File to Upload window appears.
-
Navigate to tempDir/BIPubReports.
-
Select an XDOZ file and click Open. (These are the report files.)
The Upload dialog box appears.
-
Click Upload.
-
Select the Data Models folder.
-
Click the Upload Resource icon.
The Upload dialog box appears.
-
Click Browse.
The Choose File to Upload window appears.
-
Navigate to tempDir/BIPubReports/Data Models.
-
Select an XDMZ file and click Open. (These are the data model files.)
The Upload dialog box appears.
-
Click Upload.
-
The sample reports are located in the BIPubReports folder, as shown in Figure 7-1, "Sample Reports in the BI Publisher Catalog".
-
Change the data model file to point it to the data source you created earlier.
See "Changing the Data Model Source" for instructions.
Understanding the Sample Reports
This section describes the following sample reports:
See "Running the Sample Reports" for information on how to run the sample reports that are described in the following sections.
Connectivity Report
This report lists available channelized connectivities based on the location provided. Also, based on the selected connectivity, the report shows Channelized Connectivity, its riders, capacity consumed by riders, and the service and party associated with the rider.
When running this report, you select a location or locations from the Location list. The Connectivity list is then populated with channelized connectivities that are present at the selected locations. You can then select a connectivity from the Connectivity list to view its riders.
Figure 7-2 shows an example of the Connectivity Report:
Connectivity Activation Report for Project Activity
Note:
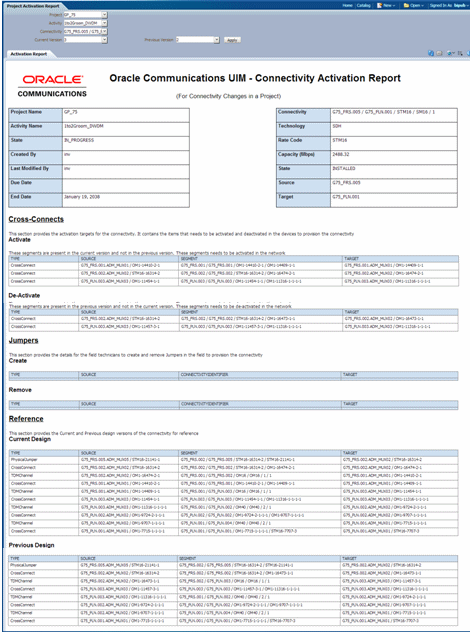
Within the BI Publisher Catalog, this report name is listed as Project Activation Report. However, when the report runs, the title of the report is Connectivity Activation Report.This report provides the activation details to provision the connectivity that has been redesigned as part of a Project Activity that may involve Grooming, Rehoming, Insert Node, or Remove Node operation. This report contains various sections that provide necessary information to provision the changes in the network that have been planned in the inventory project.
You can select project, activity, and impacted connectivity from the respective lists to view Connectivity Activation for a project Activity. Current version and previous versions will be populated automatically.
-
General Information
This section provides the details about the connectivity and the corresponding Project and Activity that is making changes in the connectivity.
-
Cross-Connect
This section provides the details of the cross connects needs to be activated or deactivated in the devices to provision the connectivity.
-
Jumper
This section provides the details of the jumpers needs to be created or removed by the field engineer in the devices to provision the connectivity.
-
Reference
This section provides the design details the connectivity before and after the completion of the Project Activity. This section is not directly used in the provisioning but rather serves as a reference to see the end to end design of the connectivity and understand what has changed in the project Activity.
When running this report, you select project, activity, and impacted connectivity. Current version and previous versions are automatically populated.
Figure 7-3 shows an example of the Connectivity Activation Report for Project Activity:
Customer Service Resource Allocation Report
This report shows all services and allocated resources for a particular customer. You select a customer name to initiate the report.
When running the report, you select a customer name.
Figure 7-4 shows an example of the Customer Service Resource Allocation Report:
Customer Services Supported by Logical Device Report
This report shows all services and associated customers for a particular logical device such as router. This report is designed for service impact analysis based on a specific logical device.
When running the report, you select a logical device.
Figure 7-5 shows an example of the Customer Services Supported by Logical Device Report:
Device Utilization Report
This report shows the capacity consumed for logical devices. It shows logical devices, assigned device interface specifications, and utilization of the device interfaces for a given location or logical device.
When running the report, you enter a location or a device ID, or both.
Figure 7-6 shows an example of the Device Utilization Report:
IPv4 Utilization Report
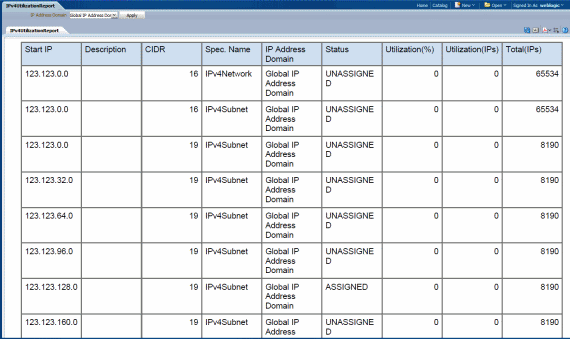
This report shows all IPv4 networks, subnets, and hosts, and the respective utilization, for a particular IP address domain.
When running the report, you select an IP address domain name.
Figure 7-7 shows an example of the IPv4 Utilization Report:
IPv6 Utilization Report
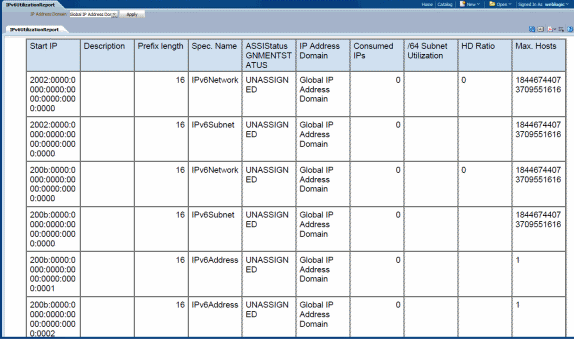
This report shows all IPv6 networks, subnets, and hosts, and the respective utilization, for a particular IP address domain.
When running the report, you select an IP address domain name.
Figure 7-8 shows an example of the IPv6 Utilization Report:
Pipe Capacity by Terminating Place Report
This report shows pipe capacity information based on the terminating place.
When running the report, you select a terminating place to see all the pipes and their capacity for that place.
Figure 7-9 shows an example of the Pipe Capacity by Terminating Place Report:
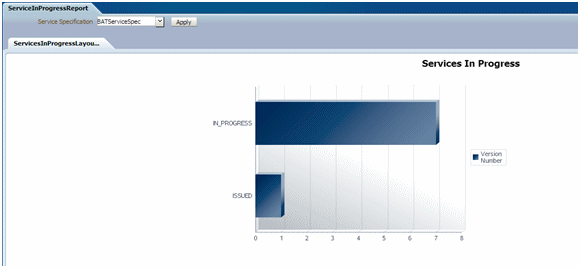
Services In Progress Report
This report shows all service instances for a particular service specification where a service configuration is in progress.
When running the report, you select a service specification to show the services in progress.
Figure 7-10 shows an example of the Services in Progress Report:
Telephone Number Reports
A set of predefined utilization reports shows the numbers of telephone numbers within a pre-defined range. These reports can be used to determine which telephone numbers are assigned and which are still available for consumption. In addition, this view provides categorization based on the consumer, such as reservation, assignment, or condition. Below is a description of each report:
-
Utilization Report by 1K Block
This report shows the number of assigned, reserved, and available telephone numbers for a block of 1,000 numbers. The report also shows the utilization percentage.
When running the report, you select the telephone number specification to view utilization for the blocks created using that specification.
Figure 7-11 shows an example of the Utilization Report by 1K Block:
-
Utilization Report by 10K Block
This report shows the number of assigned, reserved, and available telephone numbers for a block of 10,000 numbers. The report also shows the utilization percentage.
When running the report, you select the telephone number specification to view utilization for the blocks created using that specification.
Figure 7-12 shows an example of the Utilization Report by 10K Block:
-
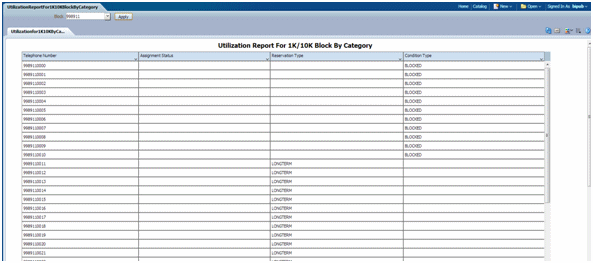
Utilization Report for 1K/10K Block by Category
This report shows the assignment status, reservation type, and condition type for telephone numbers within a block of 1,000 or 10,000.
When running the report, you select the block to view utilization of the numbers in that block.
Figure 7-13 shows an example of the Utilization Report for 1K/10K Block by Category:
-
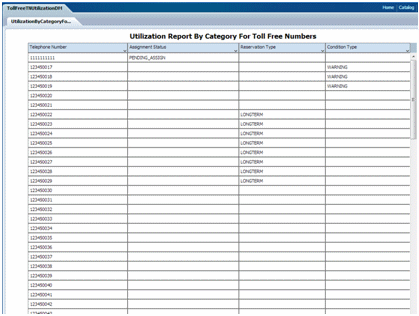
Utilization Report by Category for Toll Free Numbers
This report shows the assignment status, reservation type and condition type for toll free numbers.
Figure 7-14 shows an example of the Utilization Report by Category for Toll Free Numbers:
Running the Sample Reports
To run the sample reports:
-
Log into BI Publisher.
-
In the upper right corner of the Home page, click the Catalog link.
The Catalog appears.
-
If this is the first time you are running the sample reports, edit the data model to point to a data source. For instructions on how to do this, see "Changing the Data Model Source".
-
Expand Shared Folders, and select the BIPubReports folder.
-
Click the Open link for the report you want to run.
Depending on the report you opened, a list or lists from which to select data appears.
-
Select data from the list or lists that are present for the report you are running.
-
Click Apply to apply your data selections and run the report.
The report appears.
Modifying Existing Sample Reports
You can modify the existing sample reports by:
-
Editing Existing Sample Reports to alter the report format
-
Changing the Data Model Source to alter the data that appears in existing sample reports
-
Setting Default Parameter Values to alter the data that appears in the report
Any reports you create by modifying the existing sample reports can be run in the same manner as the sample reports. See "Running the Sample Reports" for more information.
Editing Existing Sample Reports
To edit an existing sample report:
-
Log into BI Publisher.
-
In the upper right corner of the Home page, click the Catalog link.
The Catalog appears.
-
Expand Shared Folders, and select the BIPubReports folder.
-
Click the Edit link for the report you want to edit.
-
Edit the report format.
For detailed information on editing the report format, click the Help icon on this page.
-
Click the Save icon.
Changing the Data Model Source
To change the Data Model Source:
-
Log into BI Publisher.
-
In the upper right corner of the Home page, click the Catalog link.
The Catalog appears.
-
Expand Shared Folders.
-
Expand BIPubReports, and select the Data Models folder.
-
Click the Edit link for the data model you want to edit.
-
Click Data Model.
The Properties page for the selected data model appears.
-
From the Default Data Source list, select a different data source, as shown in Figure 7-15.
-
Expand Data Model, and select Data Sets.
-
Select a data set.
The Diagram tab for the selected data set appears.
-
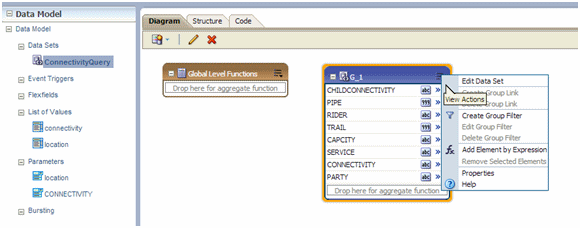
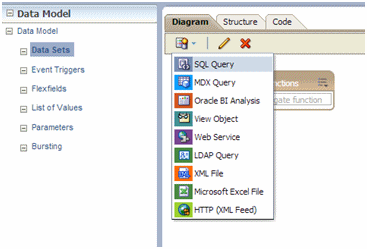
Click the View Actions list menu located in right corner of the data set, as shown in Figure 7-16.
-
From the View Actions menu, select Edit Data Set.
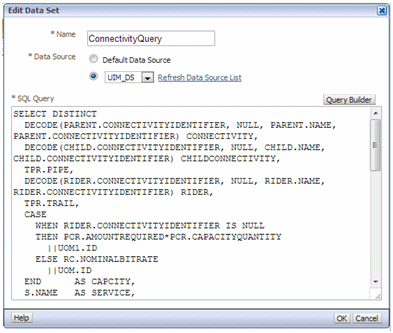
The Edit Data Set dialog box appears, as shown in Figure 7-17.
-
Change Data Source.
-
Close the Edit Data Set dialog box.
-
Click the Save icon.
Setting Default Parameter Values
To set default parameter values:
-
Log into BI Publisher.
-
In the upper right corner of the Home page, click the Catalog link.
The Catalog appears.
-
Expand Shared Folders.
-
Expand BIPubReports, and select the Data Models folder.
-
Click the Edit link for the data model you want to edit.
-
Expand Data Model, and select Parameters.
-
Select a parameter.
The Parameters page for the selected parameter appears, as shown in Figure 7-18.
-
Set or change the value in the Default Value field.
-
Click the Save icon.
Creating New Reports
You can create a new data model to create a new report. To view example queries when creating new reports, see "Viewing Example Queries".
To create a new report:
-
Understand the data model entities you intend to use in your custom report.
-
In the upper right corner of the Home page, click the New icon, and select Data Model.
The Properties page for the new data model appears.
-
From the Default Data Source list, select a data source.
-
Expand Data Model and select Data Sets.
The Diagram tab for the selected data set appears.
-
Click the New Data Set list menu and select SQL Query, as shown in Figure 7-19.
The Create Data Set - SQL dialog box opens.
-
Do one of the following:
-
Click Query Builder, select the appropriate tables, and build the query to populate the SQL Query field.
-
Copy and paste a pre-written query directly into the SQL Query field.
-
-
Click OK to close the Create Data Set - SQL dialog box.
-
Click the Save icon to save the data set.
-
Click the Get XML Output icon located next to the Save icon.
-
From the Number of rows to return list, select the number of rows to return.
-
Click Run.
-
Open the list menu located in the upper right corner of the page, and select Save as Sample Data to save the data.
The Diagram tab for the new data set appears.
-
In the upper right corner of the page, click the New icon, then select Report, then select the Using Existing Data Model link.
The Create Report window appears.
-
Select the data model and click Next.
-
Choose Guide Me and click Next.
-
From the Available Columns on the left side, select the columns that you want to appear in your report.
-
Click Finish.
-
On the Insert tab, use the listed Components to create data tables, bar charts, and so forth.
-
On the Page Layout tab, format your report by specifying portrait/landscape, headers/footers, and so forth.
-
Click the Save icon.
Any custom reports you create can be run in the same manner as the sample reports. See "Running the Sample Reports" for more information.
Viewing Example Queries
You can view the queries from any of the sample reports to use an example to follow when creating custom reports.
To view example queries:
-
Log into BI Publisher.
-
In the upper right corner of the Home page, click the Catalog link.
The Catalog appears.
-
Expand Shared Folders.
-
Expand BIPubReports, and select the Data Models folder.
-
Click the Edit link for the applicable data model.
-
Expand Data Model, and select Data Sets.
-
Select a data set.
The Diagram tab for the selected data set appears.
-
Click the View Actions list menu located in right corner of the data set, as shown in Figure 7-20.
-
From the View Actions menu, select Edit Data Set.
The Edit Data Set dialog box appears, as shown in Figure 7-21.
Here, you can view the query.
Troubleshooting BI Publisher
Refer to BI Publisher forum for troubleshooting information.
https://community.oracle.com/community/developer/english/business_intelligence/business_intelligence_foundation/bi_publisher
