1 Overview of Fraud Monitor
This chapter provides an overview of Oracle Communications Fraud Monitor.
About Fraud Monitor
The Session Monitor architecture consists of the Probe layer, Mediation Engine layer, and the Aggregation Engine layer (see the discussion about Session Monitor architecture in Session Monitor Installation Guide for information about the functions performed in each layer).
Fraud Monitor runs on the Aggregation Engine (AE) machine, but relies on the data provided by the Mediation Engines (MEs) to detect fraud. For each established call, the ME that has correlated the call, sends a notification to the AE, when the call is established, then one notification every few minutes and finally a notification at the end of the call. This allows Fraud Monitor to be aware of the real-time state of all the calls in the system and use this state to apply the different behavioral rules.
Logging In to Fraud Monitor
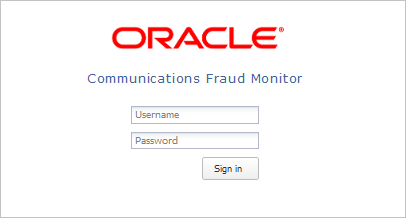
The Login page allows you to access Fraud Monitor. Enter your user name and password into the indicated fields, then click Sign in to proceed to the application.
Figure 1-1 shows the Fraud Monitor Login page.
In the case your user name or password are incorrect, a warning appears below the Sign in button and you'll have the opportunity to retry.
About Using the Fraud Monitor User Interface
The Fraud Monitor user interface has several recurring elements. At the very top, you have the dark bar which gives access to general settings like system information and logout. Below the dark bar on the right is the navigation menu that lets you navigate to the main pages: Overview page, Incidents page, Details page, and the Settings page.
The Overview page shows the current fraud status at a glance. It has big warning indicators as well as a table of the recent potential fraud incidents. From there you can further analyze the latest issues.
The Incidents page displays the full table of recent incidents, with related rules, and from there you can pick an incident for further investigation.
The Details page shows a single user and his incidents. This page contains a short history of the potential fraud that might have occurred.
Overview Page
The Overview page is the landing page that appears automatically after you log in. The Overview page displays the status information on processed calls, incidents, users, as well as general information about how Fraud Monitor works. You use this page to check for recent incidents and then navigate to other pages to further investigate the user.
Figure 1-2 shows the Overview page.
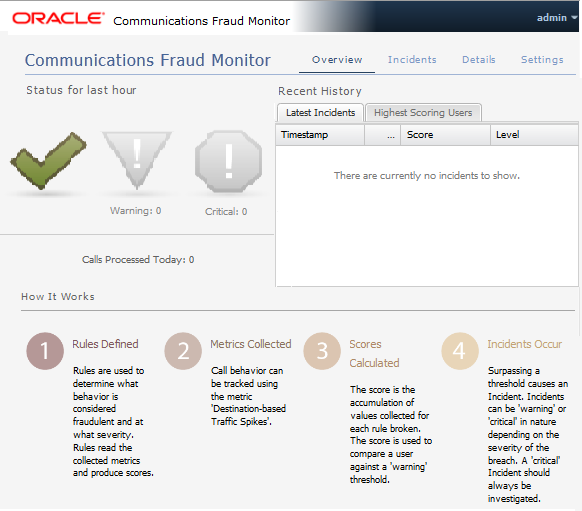
Viewing the Status for the Last Hour
The Status for the Last Hour section displays the total number of calls processed for the day and the number of incidents detected in the last hour. The incident counts are accompanied by large icons for quickly establishing overall status. If no incidents are detected, a large green tick image is displayed. If any warning incidents are detected, a large orange warning sign image is displayed. If any critical incidents are detected, a large red stop sign image is displayed. It's possible for warning incidents and critical incidents to be detected in the same time frame. When an icon is not being displayed, it remains faded grey in the background.
Note:
If the calls processed counter is not increasing, you may not have configured your Mediation Engine correctly.Viewing the Latest Incidents
On the right-hand side of the page, the Latest Incidents section shows a small list of the most recently detected incidents. A more extensive list can be found on the Incidents page. Double-clicking on an incident will take you to the Details page for that particular offending user.
Incidents Page
The Incidents page lists all the calls which have triggered incidents. This includes warning and critical incidents. See the Settings page to configure incident levels. As incidents are triggered they are added to the Incidents page in real-time.
The latest incidents are on top and incidents are not cleared; they stay forever unless you delete them yourself (see below). The Suspect column is the callers number or IP address.
Note:
Fraud Monitor captures only the Phone number and not the call conversation.When a line is selected, the panel on the right shows the details of this incident. It displays the caller as well as which rule or rules caused the incident to be triggered.
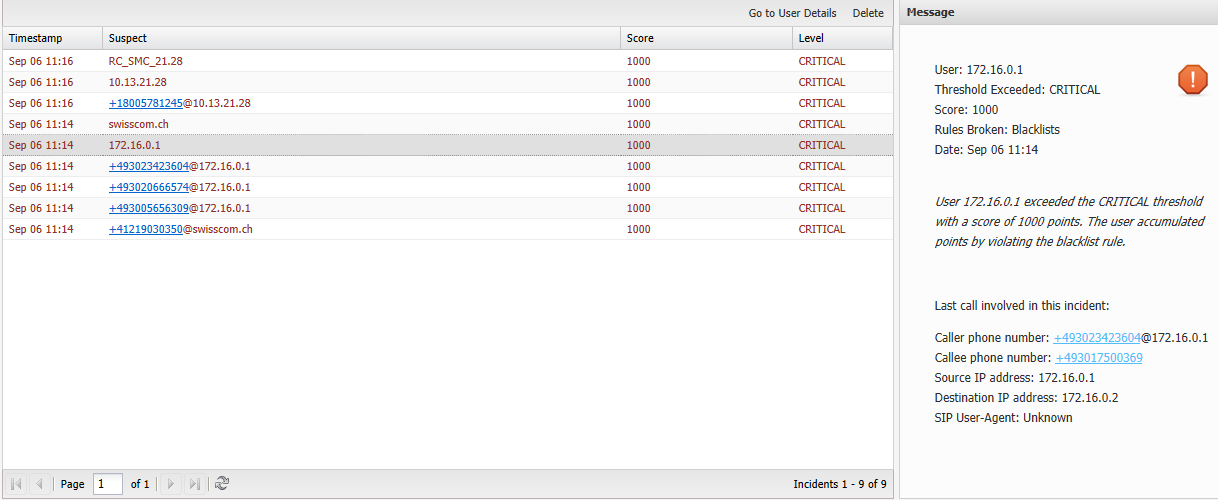
If you double-click on an incident, you'll go to the Details page for that user. Selecting a row and clicking Go to User Details button does the same.
If a user first triggers a warning incident and later upgrades that to a critical incident, both will be listed.
You can delete an incident by selecting it and clicking Delete. This will remove the incident from the list. When user causes multiple incidents of the same level (warning or critical) within 24 hours, a new incident is not triggered. Deleting a row from the incident list will not reset that timer. Deleting an incident is useful when, after investigation, you conclude that an incident is not fraudulent.
Times are in the local time zone.
Details Page
The Details page shows information on a particular user. Also, the whitelist for countries of this user can be maintained on this page and all records associated with this user may be deleted.
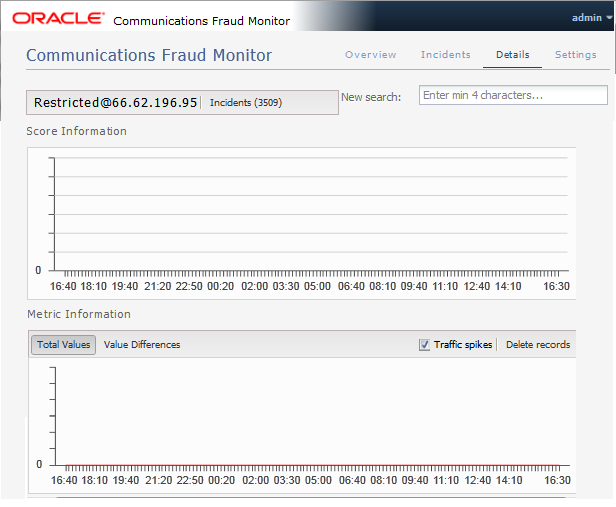
Figure 1-4 shows the Details page.
The Details page can be reached via the top menu or from the Incidents page.
Typically, in this view one will search a user, if none is selected yet, and then consider the metrics to determine if an incident is justified. In case no user has been chosen, one must be selected using the search field. Then the scores, the calls, and the geographical data for this user are displayed. Each of these topics is explained in the following sections.
Performing a User Search
The New search field allows you to select a user for display by IP or phone number. After four characters matches are shown. Select one of the proposed matches, press return or click Search to display the user.
Deleting User-Specific Records
Click Delete records to remove all information regarding the user. This includes metric values, scores and incident related information.
Viewing Score Information
The Score Information diagram shows scoring information of all incidents for the last 24 hours, going back from the current time. It is not possible to go further back than 24 hours. For each incident measuring interval, a bar displays the score reached.
Viewing Metric Information
The Metric Information diagram show metrics of selected rules. For each ten minute interval, the values of the last 24 hours are shown in comparison to the average over the last two weeks.
The y-axis displays the number of minutes or calls, while the x-axis specifies the intervals. A red line displays the averages, while the bars show the current data.
By using the check boxes in the top right corner, you can choose what values to display.
-
The traffic spikes
The alternative display modes in the top left corner, Total Values and Value Differences, toggle between displaying the current values as absolute values and as the difference to the average.
User Menu
The User menu is located on the top right corner of the page on the header bar. A drop-down menu appears when you click on your user name.
Figure 1-5 shows the User menu.
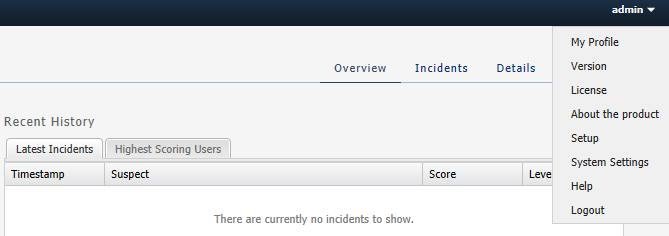
Editing the User Profile
You can edit your own profile details by selecting My Profile in the User menu. A dialog box appears giving you the option to change your user name, email and password. Fill out the new values for the details you would like to change and click Finish to save the changes. Click Cancel to exit the window without making changes.
Viewing System Information
You can view the current system information by selecting System Info in the User menu.
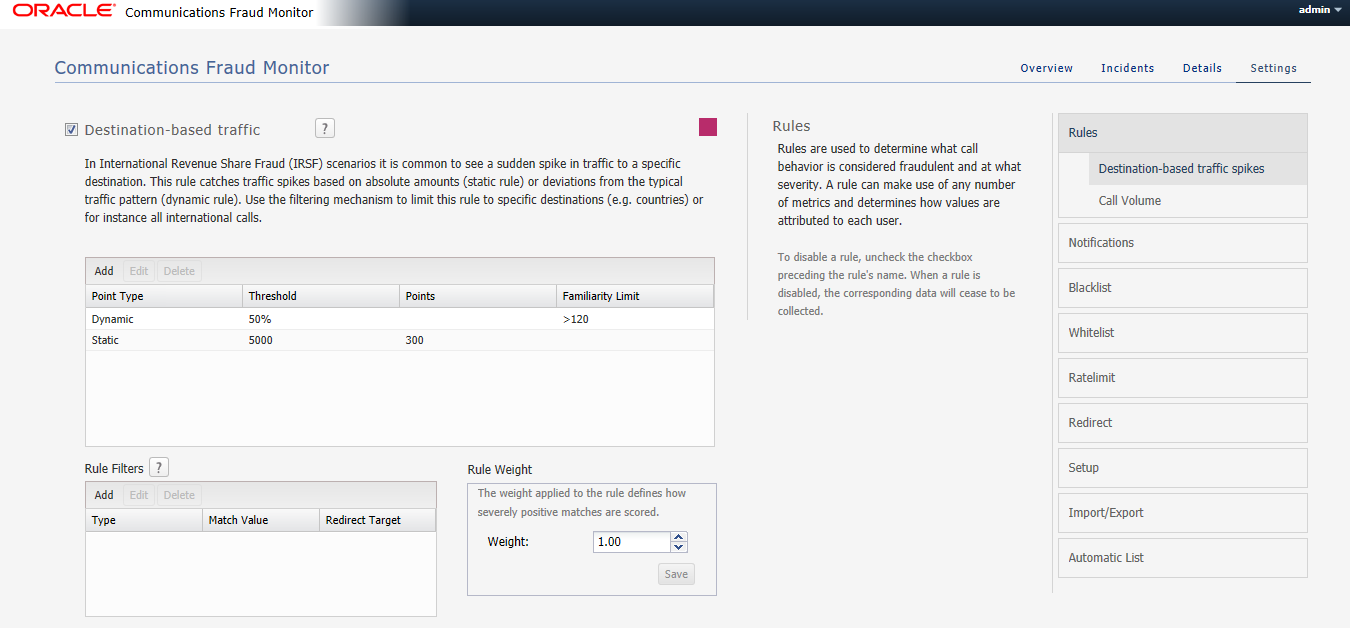
Settings Page
TThe Settings page of the Fraud Monitor user interface lets you configure the rules, manage the users, adapt the notifications, specify blacklists, whitelists, ratelimit, redirect, import/export lists, and generate automatic lists required for a successful operation of Fraud Monitor.
Among the settings, rules is the most important setting. In the Rules section, you can enable and configure patterns that are used to detect fraud and trigger incidents.