Diagnostic Service Logs Structure and Properties Description
To effectively analyze and interpret diagnostic service logs, it's imperative to understand the underlying structure and the description of each property that you see in the JSON view.
Sample Diagnostic Service Logs Structure
Understanding the structure of diagnostic service logs is the key to effective analysis and interpretation.
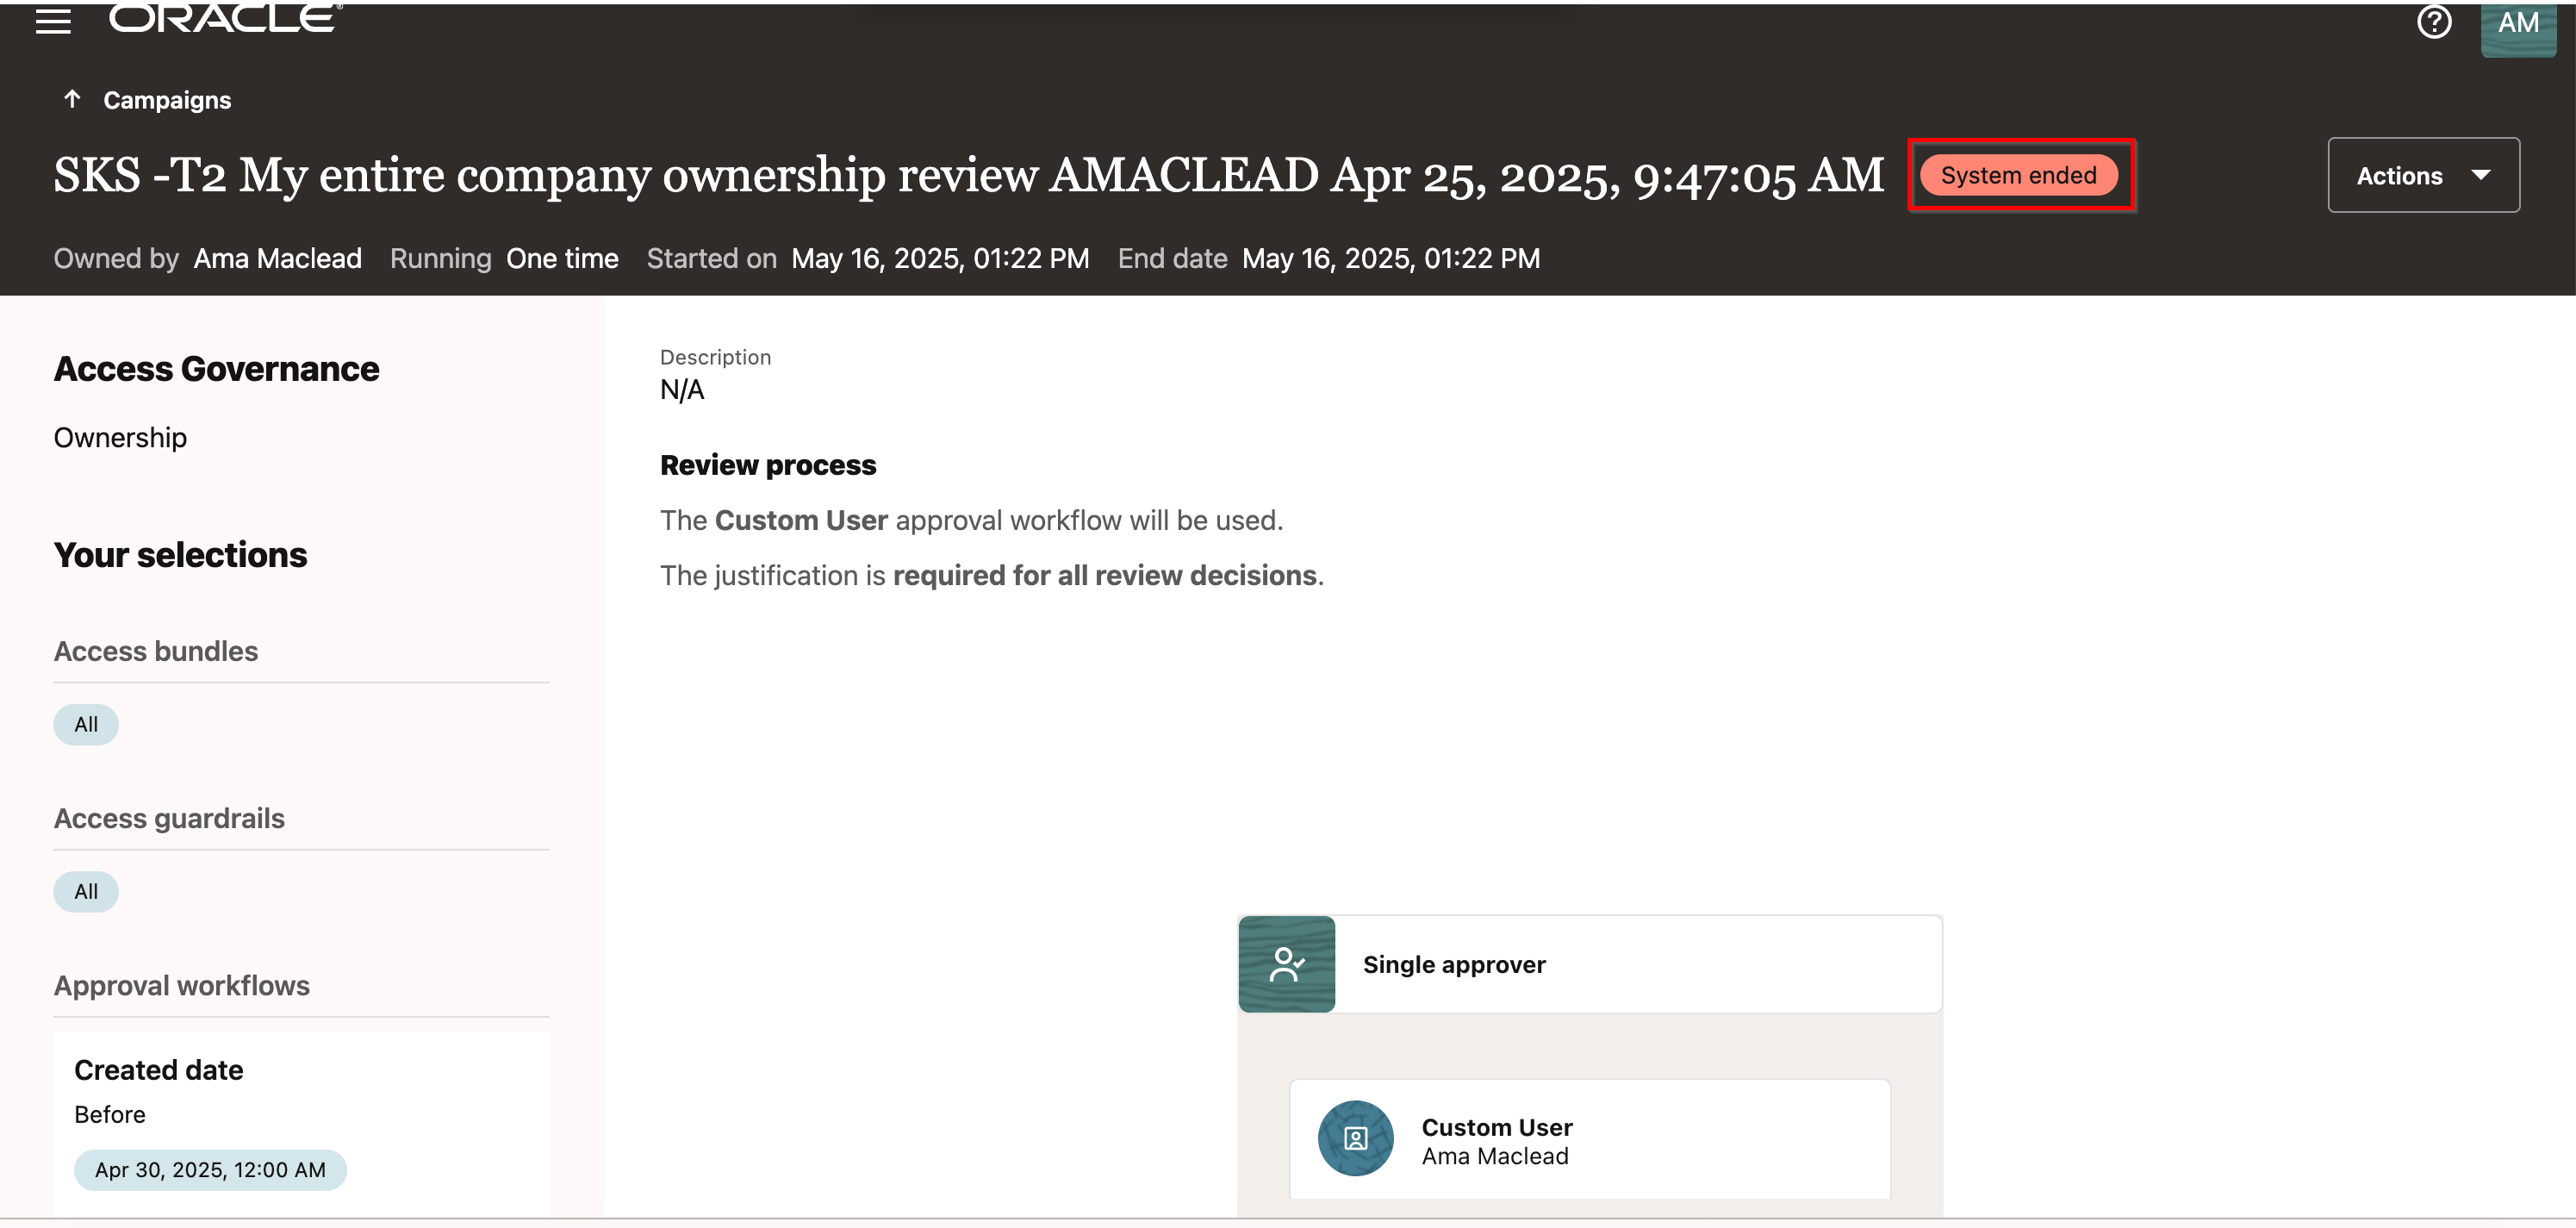
Here's a screen shot of a campaign creation that fails, indicated by a “System ended” status message in the Oracle Access Governance Service Instance Console.
You can view the corresponding service log in the Oracle Cloud Infrastructure (OCI) Console for the above campaign. Here's the service log structure in JSON format:
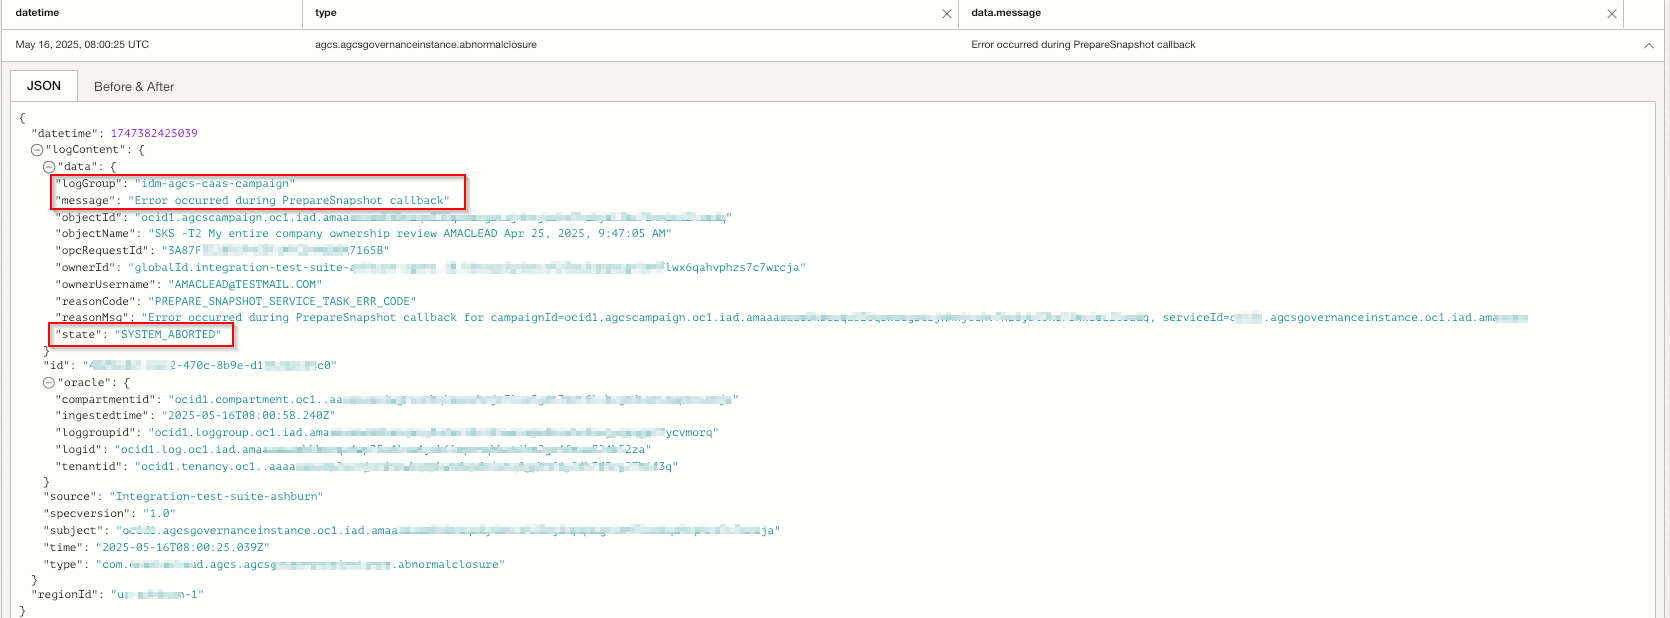
To learn how to search and filter a service log, see Search Service Logs.
Diagnostic Service Logs Properties Definition
Here's the details about the properties of a service log depicted in the JSON view.
| Properties | Description |
|---|---|
| time | Time when a specific log entry is generated. |
| data/message | Summary of the log event. |
| data/state | State of the resource. |
| data/objectName | Name of the resource or entity for which the diagnostic log is generated. |
| data/objectId | ID of the resource or entity for which the diagnostic log is generated. |
| data/ownerUsername | Refers to the user name. |
| data/ownerId | Refers to the user ID. |
| data/reasonCode | Refers to the error code. |
| data/reasonMsg | Textual description of the error code. |
| data/logGroup | Module name from where logging is getting generated. |
| data/opcRequestId | Unique Oracle-assigned request ID. |
| data/additionalDetails | Service specific additional information, if any. |
| id | Unique identifier for this batch ingestion. |
| oracle/logid | OCID of the OCI Logging log object. |
| source | Name of the resource that generated the message. |
| specversion | Version of the log schema used by OCI Logging. |
| type | Specifies the log category. |