Azure Monitor
This topic explains how to monitor your Oracle AI Database@Azure resources using Azure Monitor.
Azure Monitor offers a comprehensive solution for collecting, analyzing, and responding to monitoring data from your Oracle AI Database@Azure environments. It helps maximize the availability and performance of your Oracle AI Database services by providing valuable performance insights. With Azure Monitor, you can monitor Oracle Autonomous AI Database, Oracle Exadata Database Service on Dedicated Infrastructure, Oracle Exadata Database Service on Exascale Infrastructure, and Oracle Base Database Service. This allows you to track the health and performance of your databases and respond to system events either manually or programmatically.
Metrics
This topic explains how to monitor metrics.
- View the Exadata VM Cluster Metrics
- From the Azure portal, select Oracle AI Database@Azure.
- From the left menu, select Oracle Exadata Database Service on Dedicated Infrastructure, and then select the Oracle Exadata VM Clusters tab.
- Select your Exadata VM Cluster that you want to monitor.
- From the left menu, expand the Monitoring section, and then select Metrics.
- Select the Metric dropdown list to view all the available metrics.
Note
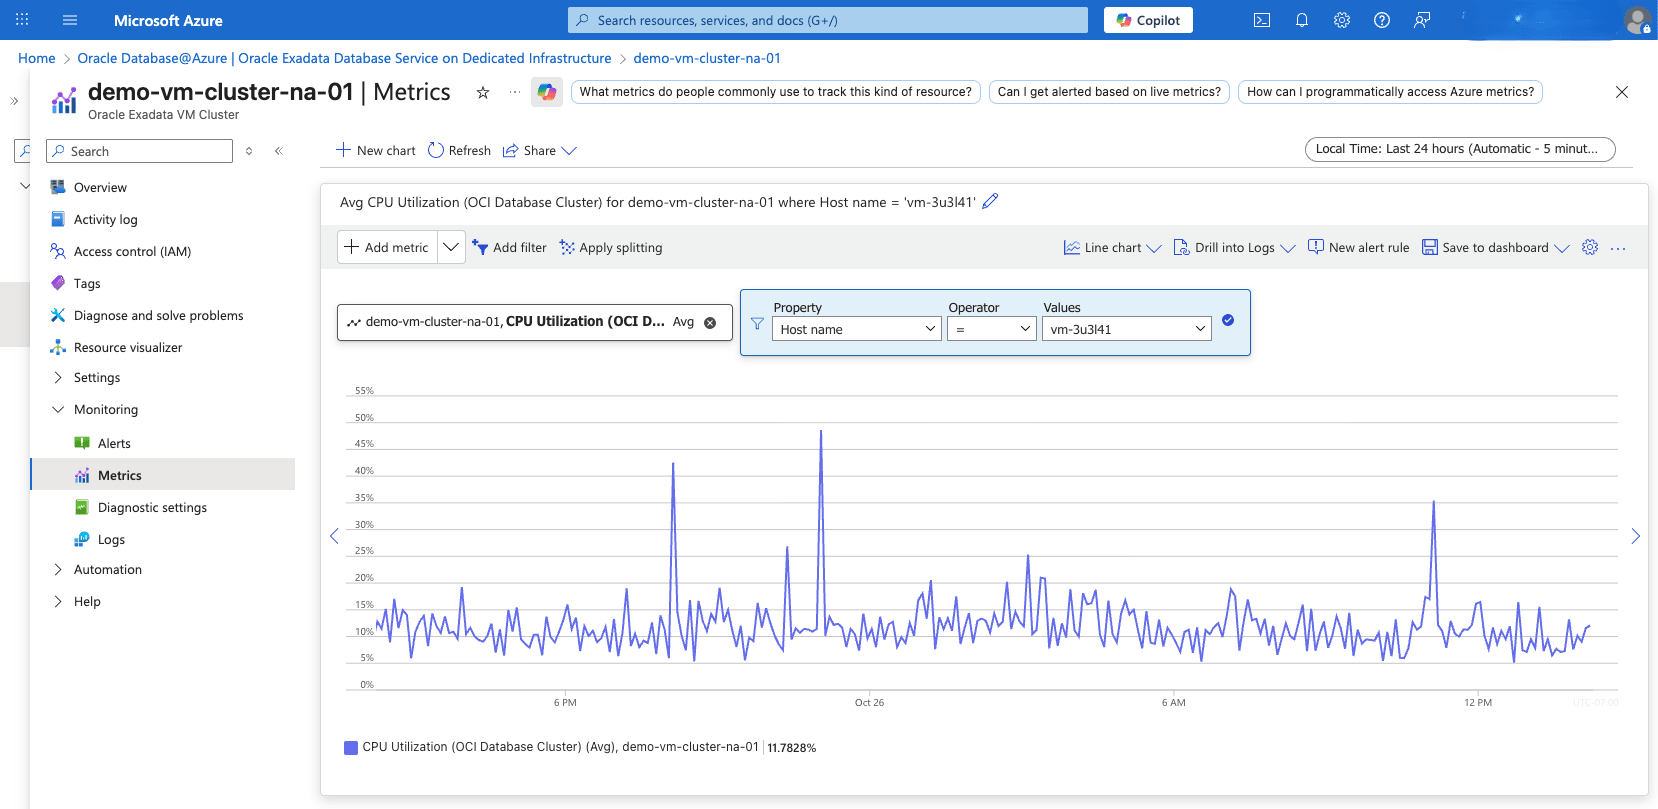
Some metrics, such as CPU Utilization, may appear multiple times with different labels. For example, CPU Utilization (OCI Database Cluster), CPU Utilization (OCI Database), and CPU Utilization (Oracle OCI Database).- OCI Database Cluster is for the VM Cluster metrics.
- OCI Database is for the Container Database metrics
- Oracle OCI Database is for the Pluggable Database metrics.
- To view metrics at the individual VM level within the cluster, use the Filter option. Set Property to Host Name, Operator to =, and Values to your specific hostname.
View Exadata Container Database Metrics- From the Azure portal, select Oracle AI Database@Azure.
- From the left menu, select Oracle Exadata Database Service on Dedicated Infrastructure, and then select the Oracle Exadata VM Clusters tab.
- Select your Exadata VM Cluster that you want to monitor.
- From the left menu, expand the Monitoring section, and then select Metrics.
- Select the +Add metric dropdown list to view all the available metrics for your Exadata VM Cluster.
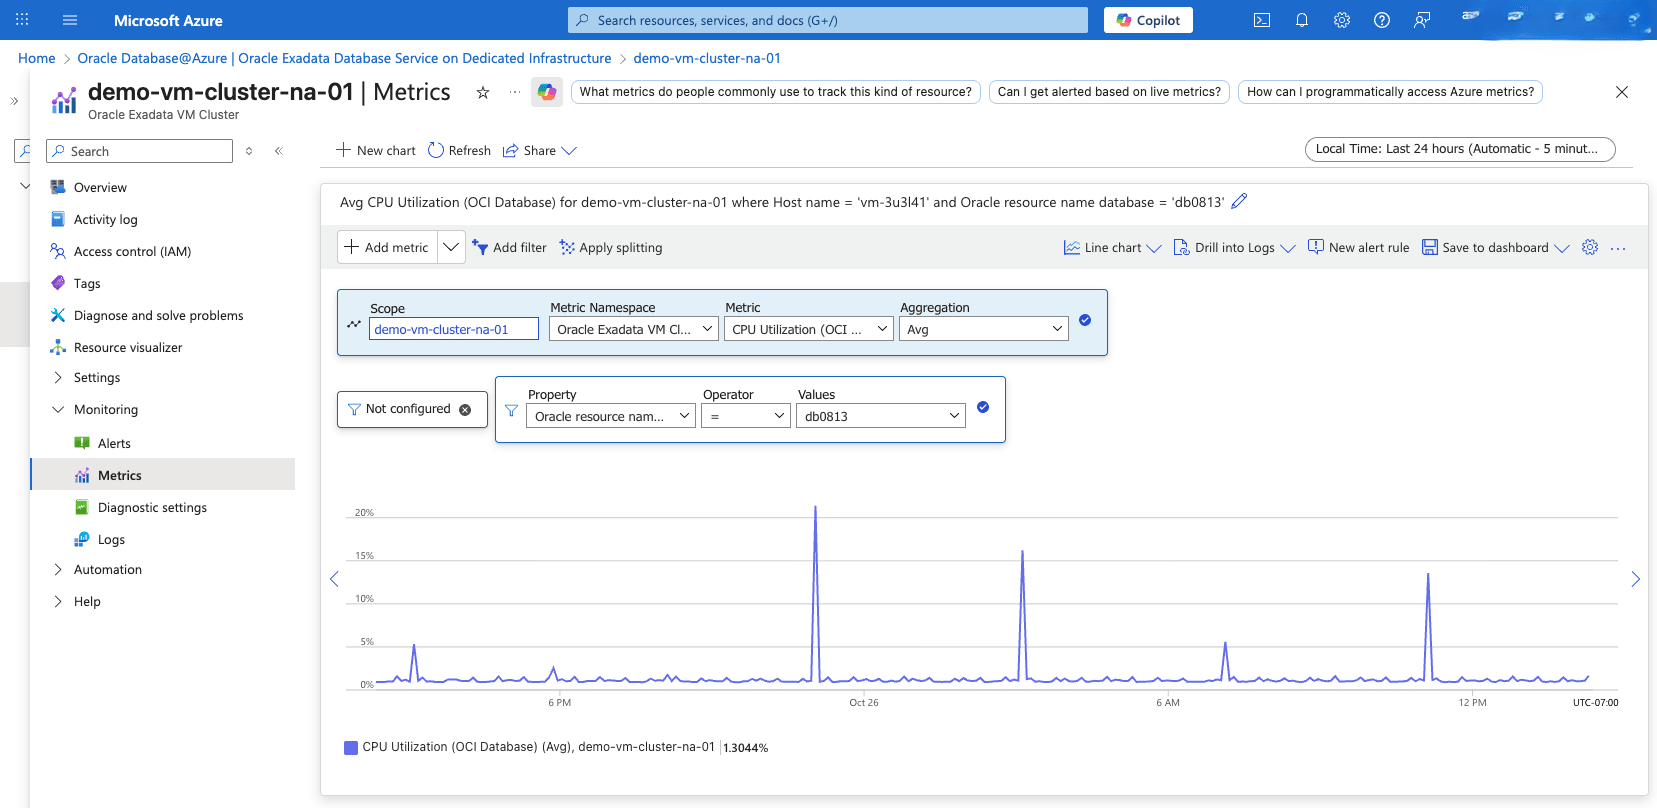
- From the Metric dropdown list, select OCI Database for the Container Database metrics.
- If you have more than one Container Database, you can filter metrics by setting Property to Oracle Resource Name Database, Operator to =, and Values to your Container Database name.
View Exadata Pluggable Database Metrics- To view Pluggable Database metrics, navigate to the OCI console and enable the Diagnostics & Managementoption in Database Management. For more information, see Enable Diagnostics & Management for Oracle Cloud Databases.
- Alternatively, you can also view the Pluggable Database Metrics in Azure Monitor.
- From the Azure portal, select Oracle AI Database@Azure.
- From the left menu, select Oracle Exadata Database Service on Dedicated Infrastructure, and then select the Oracle Exadata VM Clusters tab.
- Select your Exadata VM Cluster that you want to monitor.
- From the left menu, expand the Monitoring section, and then select Metrics.
- Select the Metric dropdown list to view all the available metrics for your Exadata VM Cluster.
- From the Metric dropdown list, select Oracle OCI Database for the Pluggable Database metrics.
- If you have more than one Pluggable Database, you can filter metrics by setting Property to Oracle Resource Name, Operator to =, and Values to your Pluggable Database name.
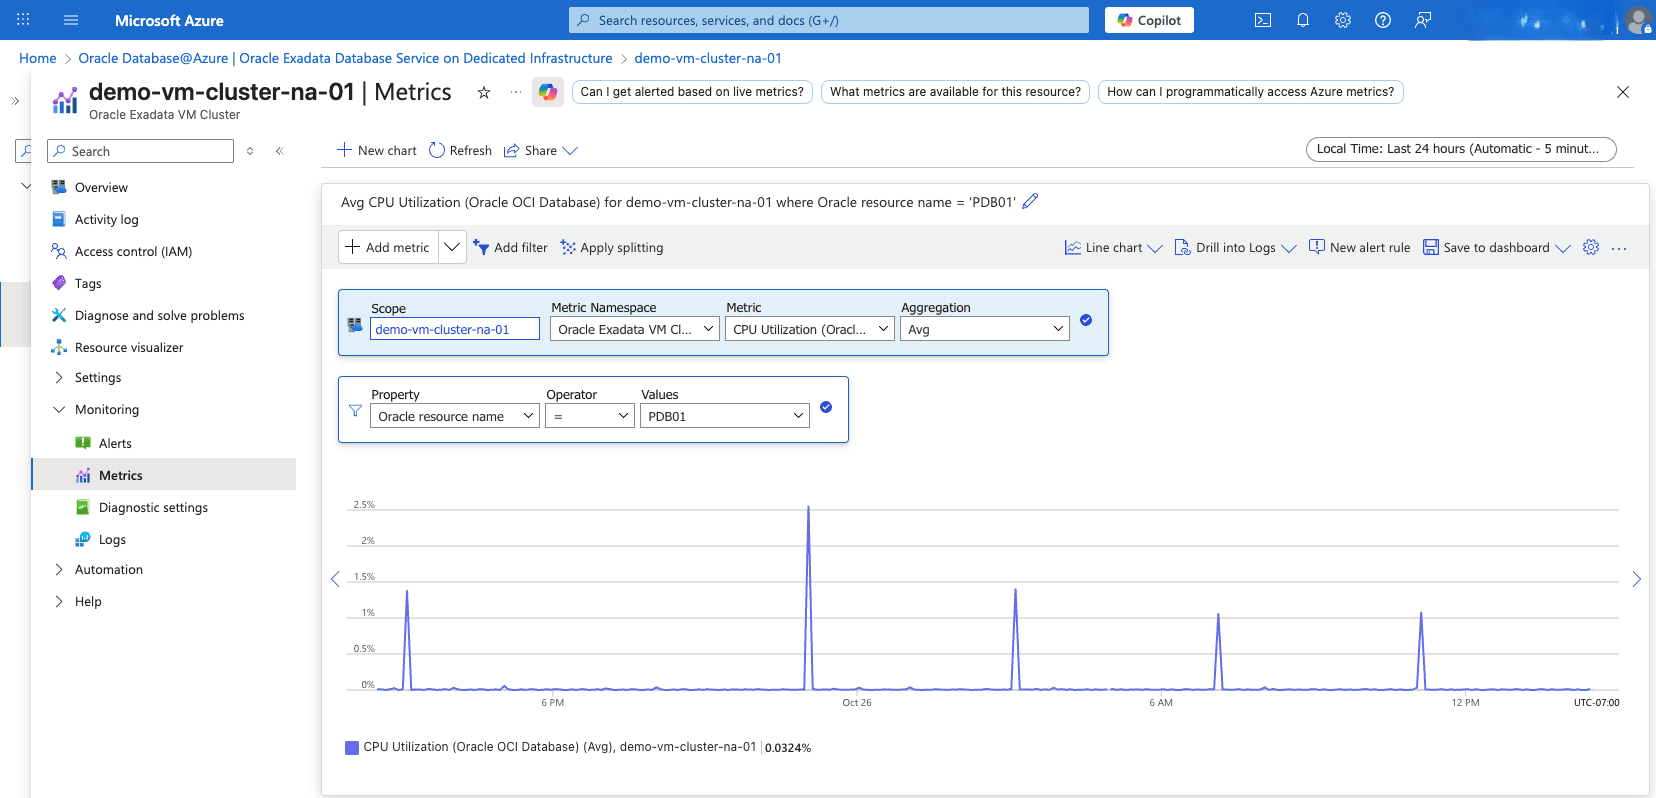
Table 1-2 Observability Metrics for Oracle Exadata Database Service on Dedicated Infrastructure
Name Description unit ASM Diskgroup Utilization Percentage of usable space used in a Disk Group. Usable space is the space available for growth. DATA disk group stores our Oracle database files. RECO disk group contains database files for recovery such as archives and flashback logs. Percent CPU Utilization (OCI Database Cluster) Percent CPU utilization Percent Filesystem Utilization Percent utilization of provisioned filesystem Percent Load Average System load average over 5 minutes Count Memory Utilization Percentage of memory available for starting new applications, without swapping. The available memory can be obtained via the following command: cat /proc/meminfo Percent Node Status Indicates whether the host is reachable. Count OCPU Allocated (OCI Database Cluster) The number of OCPUs allocated Count Swap Utilization Percent utilization of total swap space Percent CPU Utilization (OCI Database) The CPU utilization expressed as a percentage, aggregated across all consumer groups. The utilization percentage is reported with respect to the number of CPUs the database is allowed to use, which is two times the number of OCPUs. Percent Storage Utilization (OCI Database) The percentage of provisioned storage capacity currently in use. Represents the total allocated space for all tablespaces. Percent DB Block Changes (OCI Database) The Average number of blocks changed per second. CountPerSecond Execute Count (OCI Database) The number of user and recursive calls that executed SQL statements during the selected interval. Count Current Logons (OCI Database) The number of successful logons during the selected interval. Count Transaction Count (OCI Database) The combined number of user commits and user rollbacks during the selected interval. Count User Calls (OCI Database) The combined number of logons, parses, and execute calls during the selected interval. Count Parse Count The number of hard and soft parses during the selected interval. Count Storage Space Used (OCI Database) Total amount of storage space used by the database at the collection time. Bytes Storage Space Allocated Total amount of storage space allocated to the database at the collection time Bytes Storage Space Used By Tablespace (OCI Database) Total amount of storage space used by tablespace at the collection time. In case of container database, this metric provides root container tablespaces. Bytes Allocated Storage Space By Tablespace (OCI Database) Total amount of storage space allocated to the tablespace at the collection time. In case of container database, this metric provides root container tablespaces. Bytes Storage Space Utilization By Tablespace (OCI Database) This indicates the percentage of storage space utilized by the tablespace at the collection time. In case of container database, this metric provides root container tablespaces.. Percent DB Block Changes (Oracle OCI Database) The average number of blocks changed per second. CountPerSecond CPU Utilization (Oracle OCI Database) The CPU utilization expressed as a percentage, aggregated across all consumer groups. The utilization percentage is reported with respect to the number of CPUs the database is allowed to use, which is two times the number of OCPUs. Percent Current Logons (Oracle OCI Database) The number of successful logons during the selected interval. Count Execute Count (Oracle OCI Database) The number of user and recursive calls that executed SQL statements during the selected interval. Count OCPU Allocated (Oracle OCI Database) The actual number of OCPUs allocated by the service during the selected interval of time. Count Parse Count (Total) The number of hard and soft parses during the selected interval. Count Allocated Storage Space The maximum amount of space allocated by tablespace during the interval. For container databases, this metric provides data for root container tablespaces. Bytes Allocated Storage Space By Tablespace (Oracle OCI Database) The maximum amount of space allocated by tablespace during the interval. For container databases, this metric provides data for root container tablespaces. Bytes Storage Space Used (Oracle OCI Database) The maximum amount of space used during the interval. Bytes Storage Space Used By Tablespace (Oracle OCI Database) The maximum amount of space used by tablespace during the interval. For container databases, this metric provides data for root container tablespaces. Bytes Storage Utilization (Oracle OCI Database) The percentage of provisioned storage capacity currently in use. Represents the total allocated space for all tablespaces. Percent Storage Space Utilization By Tablespace (Oracle OCI Database) The percentage of the space utilized, by tablespace. For container databases, this metric provides data for root container tablespaces. Percent Transaction Count (Oracle OCI Database) The combined number of user commits and user rollbacks during the selected interval. Count User Calls (Oracle OCI Database) The combined number of logons, parses, and execute calls during the selected interval. Count Allocated Space Utilization By Tablespace The percentage of space used by tablespace, out of all allocated. For container databases, this metric provides data for root container tablespaces. Percent Average GC CR Block Receive Time The average global cache CR (consistent-read) block receive time. For RAC / cluster databases only. Milliseconds Blocking Sessions Current blocking sessions. Not applicable for container databases. Count CPU Time The average rate of accumulation of CPU time by foreground sessions in the database instance over the time interval. The CPU time component of Average Active Sessions. CountPerSecond Job Executions The number of SQL job executions on a single managed database or a database group, and their status. Status dimensions can be the following values: "Succeeded," "Failed," "InProgress." Count DB Time The average rate of accumulation of database time (CPU + Wait) by foreground sessions in the database instance over the time interval. Also known as Average Active Sessions. CountPerSecond Flash Recovery Area Limit The flash recovery area space limit. Not applicable for pluggable databases. Bytes Flash Recovery Area Utilization The flash recovery area utilization. Not applicable for pluggable databases. Percent GC CR Blocks Received The global cache CR (consistent-read) blocks received per second. For RAC / cluster databases only. CountPerSecond GC Current Blocks Received Represents global cache current blocks received per second. Statistic reports the mean value. For Real Application Cluster (RAC) databases only. CountPerSecond Average Interconnect Traffic The average internode data transfer rate. For RAC / cluster databases only. BytesPerSecond Invalid Objects Invalid database objects count. Not applicable for container databases. Count IOPS The average number of input-output operations per second. CountPerSecond IO Throughput The average throughput in MB per second. BytesPerSecond Logical Reads The average number of blocks read from SGA/Memory (buffer cache) per second. CountPerSecond Max Tablespace Size The maximum possible tablespace size. For container databases, this metric provides data for root container tablespaces. Bytes Memory Usage Memory pool total size in MB. Bytes Monitoring Status The monitoring status of the resource. If a metric collection fails, error information is captured in this metric. Count Non Reclaimable Fast Recovery Area The Non-reclaimable fast recovery area. Not applicable for pluggable databases. Percent Parses By Type The number of hard or soft parses per second. CountPerSecond Problematic Scheduled DBMS Jobs The problematic scheduled database jobs count. Not applicable for container databases. Count Process Count The database processes count. Not applicable for pluggable databases. Count Process Limit Utilization The process limit utilization. Not applicable for pluggable databases. Percent Reclaimable Fast Recovery Area The reclaimable fast recovery area. Not applicable for pluggable databases. Percent Flash Recovery Area Reclaimable Space The flash recovery area reclaimable space. Not applicable for pluggable databases. Bytes Redo Generated The average amount of redo generated, in MB per second. BytesPerSecond Session Limit Utilization The session limit utilization. Not applicable for pluggable databases. Percent Sessions The number of sessions in the database. Count Transactions By Status The number of committed or rolled back transactions per second. CountPerSecond Unusable Indexes Unusable indexes count in database schema. Not applicable for container databases. Count Usable Fast Recovery Area The useable fast recovery area. Not applicable for pluggable databases. Percent Flash Recovery Area Usage The flash recovery area space usage. Not applicable for pluggable databases. Bytes Wait Time The average rate of accumulation of non-idle wait time by foreground sessions in the database instance over the time interval. The wait time component of Average Active Sessions. CountPerSecond - View Autonomous AI Database Metrics
- From the Azure portal, select Oracle AI Database@Azure.
- From the left menu, select Oracle Autonomous AI Database, and then select your Autonomous AI Database that you want to monitor.
- From the left menu, expand the Monitoring section, and then select Metrics.
- Select the Metric dropdown list to view all the available metrics for your Autonomous AI Database.
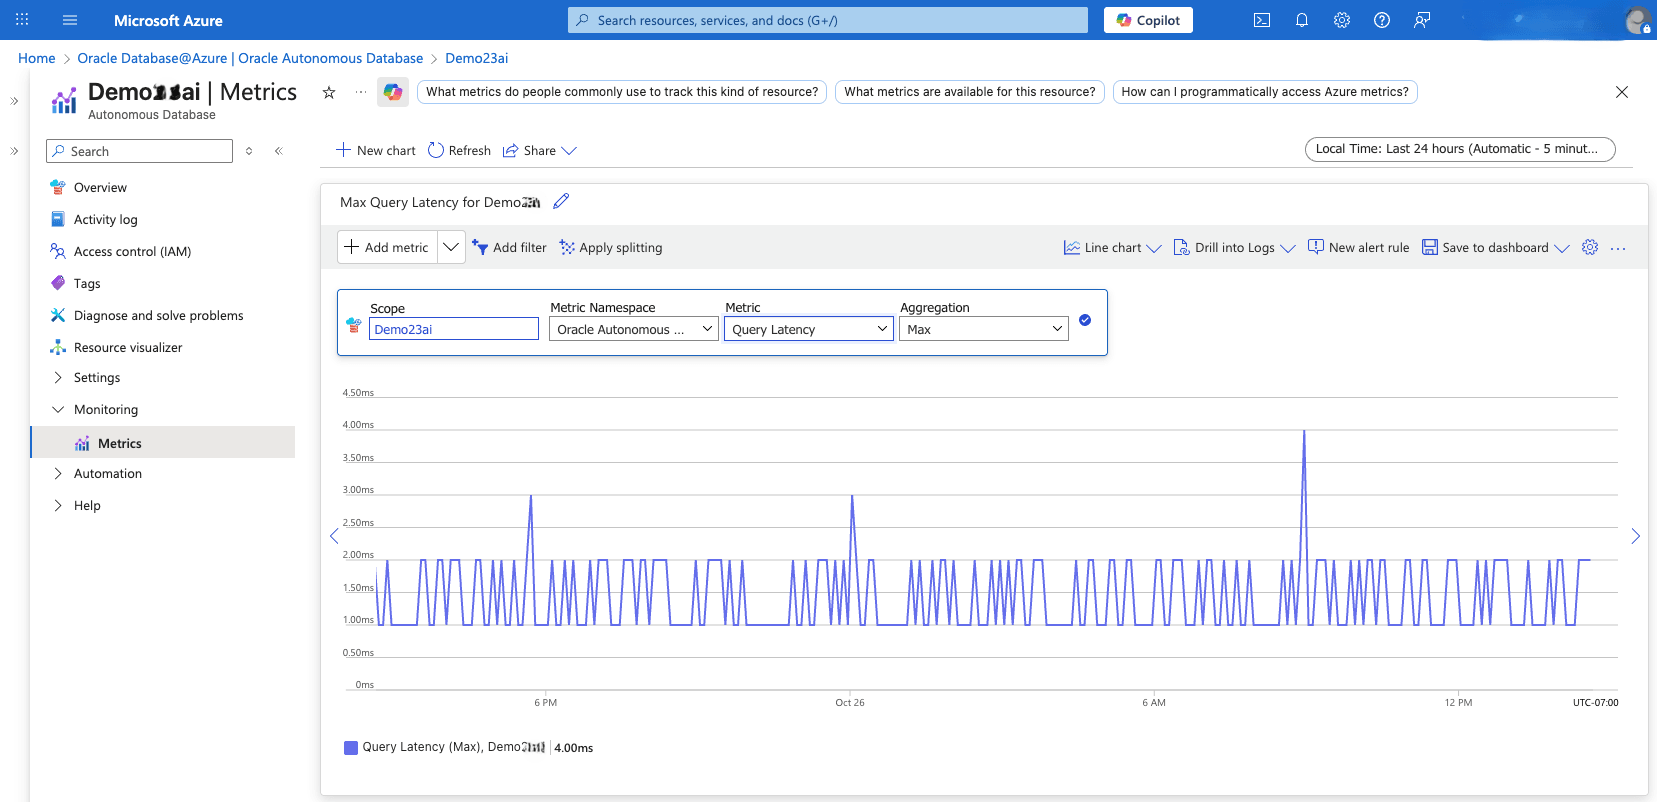
Table 1-3 Observability Metrics for Autonomous AI Database
Name Description Unit Connection Latency The time taken to connect to an Oracle Autonomous AI Database Serverless instance in each region from a Compute service virtual machine in the same region. Milliseconds Blocking Sessions The number of current blocking sessions. Count CPU Time Average rate of accumulation of CPU time by foreground sessions in the database over the time interval. Count Per Second CPU Utilization The CPU usage expressed as a percentage, aggregated across all consumer groups. The utilization percentage is reported with respect to the number of CPUs the database is allowed to use. Percent Current Logons The number of successful logons during the selected interval. Count Database Availability The database is available for connections in the given minute, with possible values: 1 = DB Available, 0 = DB Unavailable. Count DB Block Changes The number of changes that were part of an update or delete operation that were made to all blocks in the SGA. Such changes generate redo log entries and thus become permanent changes to the database if the transaction is committed. This approximates total database work. This statistic indicates the rate at which buffers are being dirtied, during the selected time interval. Count DB Time The amount of time database user sessions spend executing database code (CPU Time + WaitTime). DB Time is used to infer database call latency, because DB Time increases in direct proportion to both database call latency (response time) and call volume. It is calculated as the average rate of accumulation of database time by foreground sessions in the database over the time interval. Count Per Second Execute Count The number of user and recursive calls that executed SQL statements during the selected interval. Count Failed Logons The number of log ons that failed because of an invalid user name and/or password, during the selected interval. Count Failed Connections The number of failed database connections. Count Parse Count (Hard) The number of parse calls (real parses) during the selected time interval. A hard parse is an expensive operation in terms of memory use, because it requires Oracle to allocate a workheap and other memory structures and then build a parse tree. Count Session Logical Reads The sum of "db block gets" plus "consistent gets", during the selected time interval. This includes logical reads of database blocks from either the buffer cache or process private memory. Count Parse Count (Total) The number of hard and soft parses during the selected interval. Count Parse Count (Failures) The number of parse failures during the selected time interval. Count Peer Lag The total time in seconds by which the Disaster Recovery peer lags behind its Primary database. For a local Disaster Recovery peer, the metric is displayed under the Primary database. For a cross-region Disaster Recovery peer, this metric is displayed under the Disaster Recovery peer. Seconds Physical Reads The number of data blocks read from disk, during the selected time interval. Count Physical Read Total Bytes The size in bytes of disk reads by all database instance activity including application reads, backup and recovery, and other utilities, during the selected time interval. Count Physical Writes The number of data blocks written to disk, during the selected time interval. Count Physical Write Total Bytes The size in bytes of all disk writes for the database instance including application activity, backup and recovery, and other utilities, during the selected time interval. Count Query Latency The time taken to display the results of a simple query on the user's screen. Milliseconds Queued Statements The number of queued SQL statements, aggregated across all consumer groups, during the selected interval. Count Redo Generated Amount of redo generated in bytes, during the selected time interval. Count Running Statements The number of running SQL statements, aggregated across all consumer groups, during the selected interval. Count Sessions The number of sessions in the database. Count Bytes Received via SQLNet from Client The number of bytes received from the client over Oracle Net Services, during the selected time interval. Count Bytes Received via SQLNet from DBLink The number of bytes received from a database link over Oracle Net Services, during the selected time interval. Count Bytes Sent via SQLNet to Client The number of bytes sent to the client from the foreground processes, during the selected time interval. Count Bytes Sent via SQLNet to DBLink The number of bytes sent over a database link, during the selected time interval. Count Storage Space Allocated Amount of space allocated to the database for all tablespaces, during the interval. Bytes Maximum Storage Space Maximum amount of storage reserved for the database during the interval. Bytes Storage Space Used Maximum amount of space used during the interval. Bytes Storage Utilization The percentage of the reserved maximum storage currently allocated for all database tablespaces. Represents the total reserved space for all tablespaces. Percent Transaction Count The combined number of user commits and user rollbacks during the selected interval. Count User Calls The combined number of logons, parses, and execute calls during the selected interval. Count User Commits The number of user commits during the selected time interval. When a user commits a transaction, the generated redo that reflects the changes made to database blocks must be written to disk. Commits often represent the closest thing to a user transaction rate. Count User Rollbacks Number of times users manually issue the ROLLBACK statement or an error occurs during a user's transactions, during the selected time interval. Count Wait Time Average rate of accumulation of non-idle wait time by foreground sessions in the database over the time interval. Count Per Second Active APEX Applications The number of APEX applications that had activity over the time interval. Count APEX Page Events The number of APEX page events over the time interval. Count APEX Page Load Time Average APEX page execution time over the time interval. Count Per Second APEX Workspace Count Total number of user-created APEX workspaces at given time. Count - View Oracle Base Database Service Metrics
- From the Azure portal, select Oracle AI Database@Azure.
- From the left menu, select Oracle Base Database Service , and then select your Base Database that you want to monitor.
- From the left menu, expand the Monitoring section, and then select Metrics.
- Select the Metric dropdown list to view all the available metrics.
Note
Some metrics, such as CPU Utilization, may appear multiple times with different labels. For example, CPU Utilization (OCI Database Cluster), CPU Utilization (OCI Database), and CPU Utilization (Oracle OCI Database).- OCI Database Cluster is for the VM Cluster metrics.
- OCI Database is for the Container Database metrics
- Oracle OCI Database is for the Pluggable Database metrics.
- To view metrics at the individual VM level within the cluster, use the Filter option. Set Property to Oracle Resource Name DBNode, Operator to =, and Values to your specific hostname.
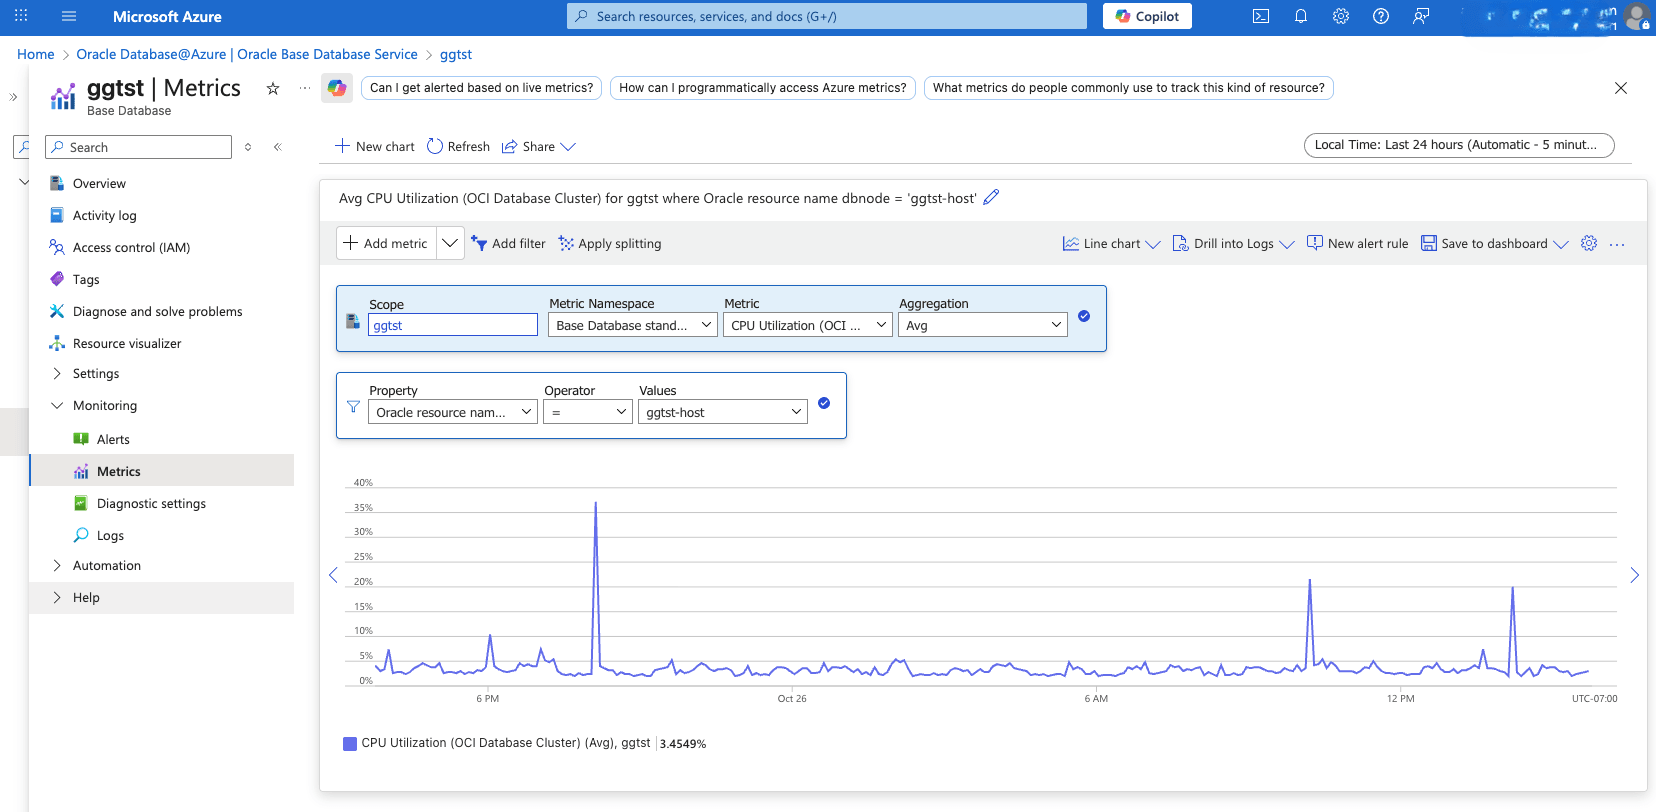
View Base Database Container Database Metrics- From the Azure portal, select Oracle AI Database@Azure.
- From the left menu, select Oracle Base Database Service , and then select your Base Database that you want to monitor.
- From the left menu, expand the Monitoring section, and then select Metrics.
- From the Metric dropdown list, select OCI Database for the Container Database metrics.
- If you have more than one Container Database, you can filter metrics by setting Property to Oracle Resource Name Database, Operator to =, and Values to your Container Database name.
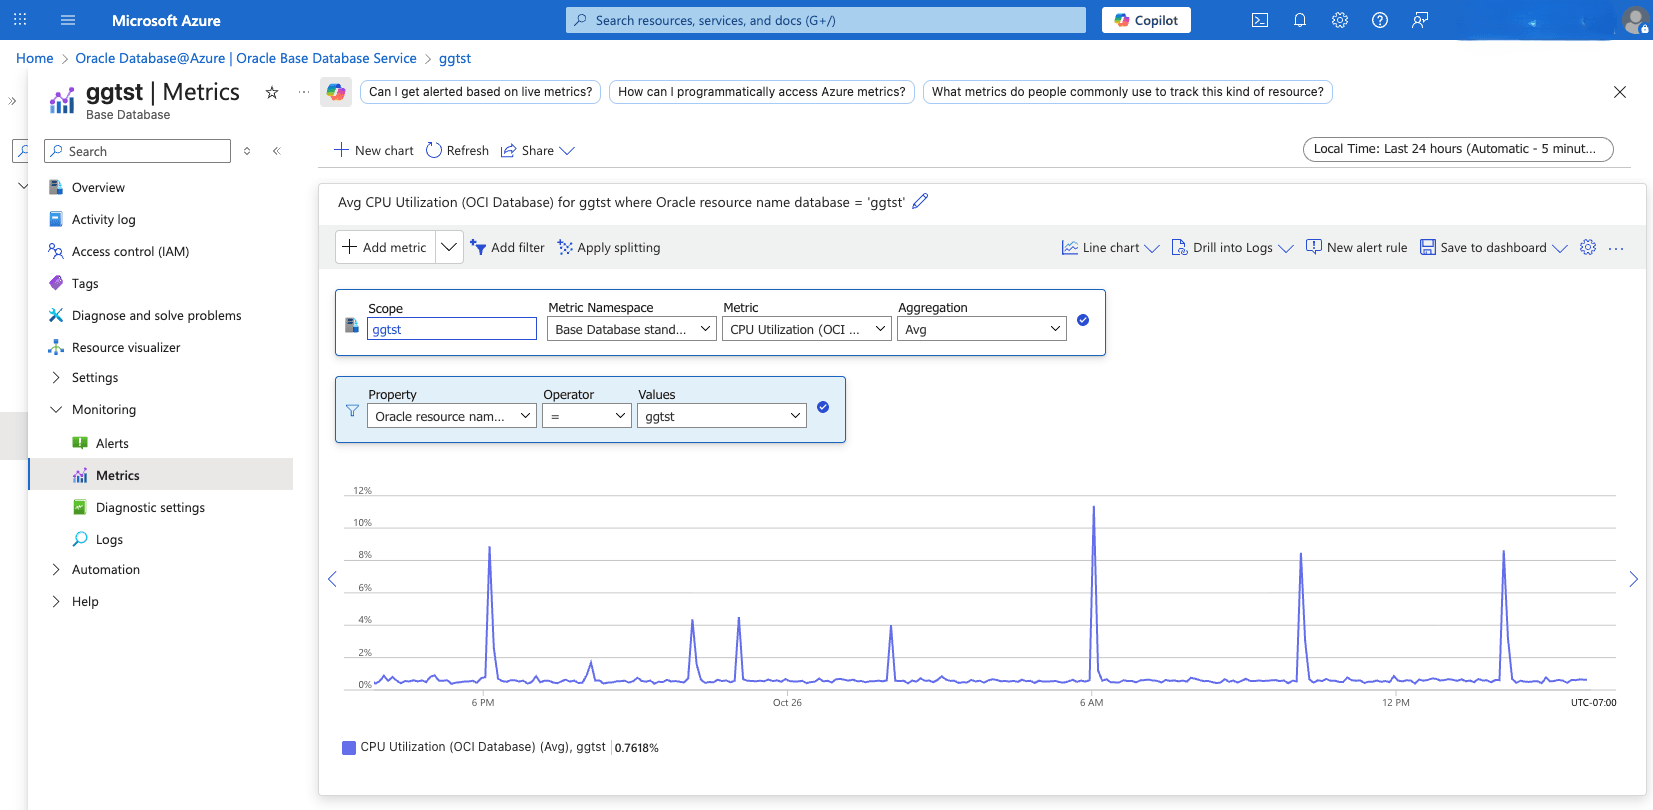
View Base Database Pluggable Database Metrics- To view Pluggable Database metrics, navigate to the OCI console and enable the Diagnostics & Managementoption in Database Management. For more information, see Enable Database Management for a Pluggable Database.
- Alternatively, you can also view the Pluggable Database Metrics in Azure Monitor.
- From the Azure portal, select Oracle AI Database@Azure.
- From the left menu, select Oracle Base Database Service , and then select your Base Database that you want to monitor.
- From the left menu, expand the Monitoring section, and then select Metrics.
- Select the Metric dropdown list to view all the available metrics for your Exadata VM Cluster.
- From the Metric dropdown list, select Oracle OCI Database for the Pluggable Database metrics.
- If you have more than one Pluggable Database, you can filter metrics by setting Property to Oracle Resource Name Database, Operator to =, and Values to your Pluggable Database name.
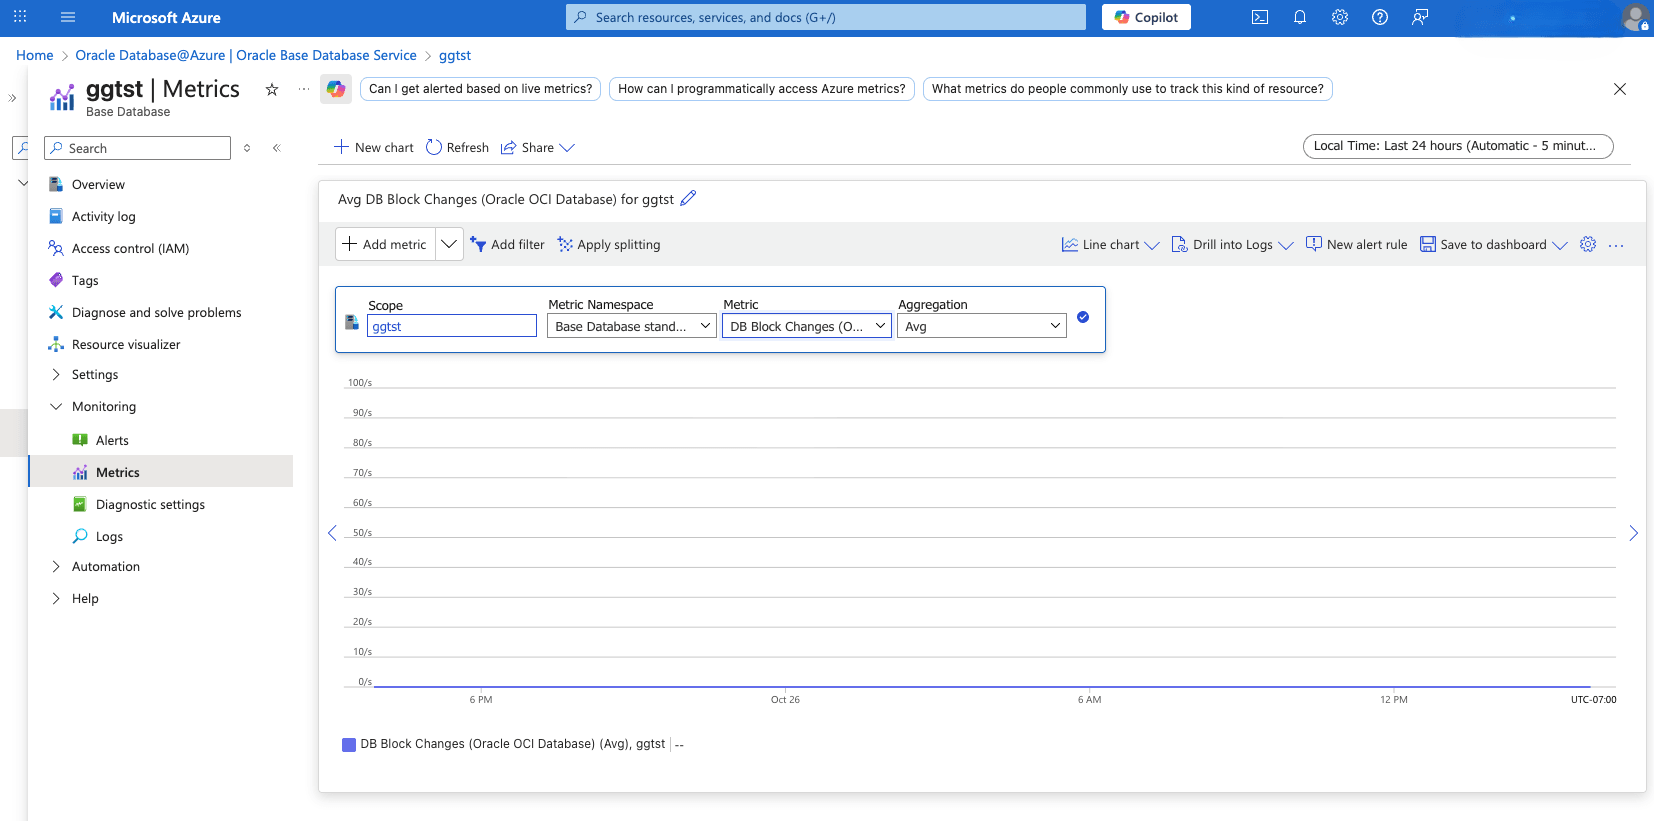
Table 1-4 Observability Metrics for Base Database
Name Description Unit CPU Utilization (OCI Database Cluster) Percent CPU utilization. Percent Filesystem Utilization Percent utilization of provisioned filesystem. Percent Load Average System load average over 5 minutes. Count Memory Utilization Percentage of memory available for starting new applications, without swapping. The available memory can be obtained via the following command: cat/proc/meminfo. Percent Node Status Indicates whether the host is reachable in RAC environments. Count OCPU Allocated (OCI Database Cluster) The number of OCPUs allocated. Count Swap Utilization Percent utilization of total swap space. Percent DB Block Changes (OCI Database) The Average number of blocks changed per second. CountPerSecond CPU Utilization (OCI Database) The CPU utilization expressed as a percentage, aggregated across all consumer groups. The utilization percentage is reported with respect to the number of CPUs the database is allowed to use, which is two times the number of OCPUs. Percent Current Logons (OCI Database) The number of successful logons during the selected interval. Count Execute Count (OCI Database) The number of user and recursive calls that executed SQL statements during the selected interval. Count Parse Count The number of hard and soft parses during the selected interval. Count Storage Space Allocated Total amount of storage space allocated to the database at the collection time. Bytes Allocated Storage Space By Tablespace (OCI Database) Total amount of storage space allocated to the tablespace at the collection time. In case of container database, this metric provides root container tablespaces. Bytes Storage Space Used (OCI Database) Total amount of storage space used by the database at the collection time. Bytes Storage Space Used By Tablespace (OCI Database) Total amount of storage space used by tablespace at the collection time. In case of container database, this metric provides root container tablespaces. Bytes Storage Utilization (OCI Database) The percentage of provisioned storage capacity currently in use. Represents the total allocated space for all tablespaces. Percent Storage Space Utilization By Tablespace (OCI Database) This indicates the percentage of storage space utilized by the tablespace at the collection time. In case of container database, this metric provides root container tablespaces. Percent Transaction Count (OCI Database) The combined number of user commits and user rollbacks during the selected interval. Count User Calls (OCI Database) The combined number of logons, parses, and execute calls during the selected interval. Count DB Block Changes (Oracle OCI Database) The average number of blocks changed per second. CountPerSecond CPU Count The number of CPUs during the selected interval Count CPU Time The average rate of accumulation of CPU time by foreground sessions in the database instance over the time interval. The CPU time component of Average Active Sessions. CountPerSecond CPU Utilization (Oracle OCI Database) The CPU utilization expressed as a percentage, aggregated across all consumer groups. The utilization percentage is reported with respect to the number of CPUs the database is allowed to use, which is two times the number of OCPUs. Percent Current Logons (Oracle OCI Database) The number of successful logons during the selected interval. Count DB Time The average rate of accumulation of database time (CPU + Wait) by foreground sessions in the database instance over the time interval. Also known as Average Active Sessions. CountPerSecond Execute Count (Oracle OCI Database) The number of user and recursive calls that executed SQL statements during the selected interval. Count Flash Recovery Area Limit The flash recovery area space limit. Not applicable for PDBs. Bytes Flash Recovery Area Utilization The flash recovery area utilization. Not applicable for PDBs. Percent IOPS The average number of IO operations per second. CountPerSecond IO Throughput The average throughput in MB per second. BytesPerSecond Logical Reads The average number of blocks read from SGA/Memory (buffer cache) per second. CountPerSecond Memory Usage The total size of the memory pool. Bytes Monitoring Status The monitoring status of the resource. If metric collection fails, error information is captured in this metric. Count Non Reclaimable Fast Recovery Area The non-reclaimable fast recovery area. Not applicable for PDBs. Percent Parse Count (Total) The number of hard and soft parses during the selected interval. Count Parses By Type The number of hard or soft parses per second. CountPerSecond Process Count The number of database processes. Not applicable for PDBs. Count Process Limit Utilization The process limit utilization. Not applicable for PDBs. Percent Reclaimable Fast Recovery Area The reclaimable fast recovery area. Not applicable for PDBs. Percent Flash Recovery Area Reclaimable Space The flash recovery area reclaimable space. Not applicable for PDBs. Bytes Redo Generation Rate The redo generation rate on the primary database. Not applicable for PDBs. BytesPerSecond Redo Generated The average amount of redo generated. BytesPerSecond Session Limit Utilization The session limit utilization. Not applicable for PDBs. Percent Sessions The number of sessions in the database. Count Transaction Count (Oracle OCI Database) The combined number of user commits and user rollbacks during the selected interval. Count Transactions By Status The number of committed or rolled back transactions per second ??? - View Oracle Exadata Database Service on Exascale Infrastructure Metrics
- From the Azure portal, select Oracle AI Database@Azure.
- From the left menu, select Oracle Exadata Database Service on Exascale Infrastructure, and then select the VM Clusters tab.
- From the list, select your VM Cluster that you want to monitor.
- From the left menu, expand the Monitoring section, and then select Metrics.
- Select the Metric dropdown list to view all the available metrics.
Note
Some metrics, such as CPU Utilization, may appear multiple times with different labels. For example, CPU Utilization (OCI Database Cluster) and CPU Utilization (OCI Database).- OCI Database Cluster is for the VM Cluster metrics.
- OCI Database is for the Container Database metrics
- To view metrics at the individual VM level within the cluster, use the Filter option. Set Property to Oracle Resource Name DBNode, Operator to =, and Values to your specific hostname.
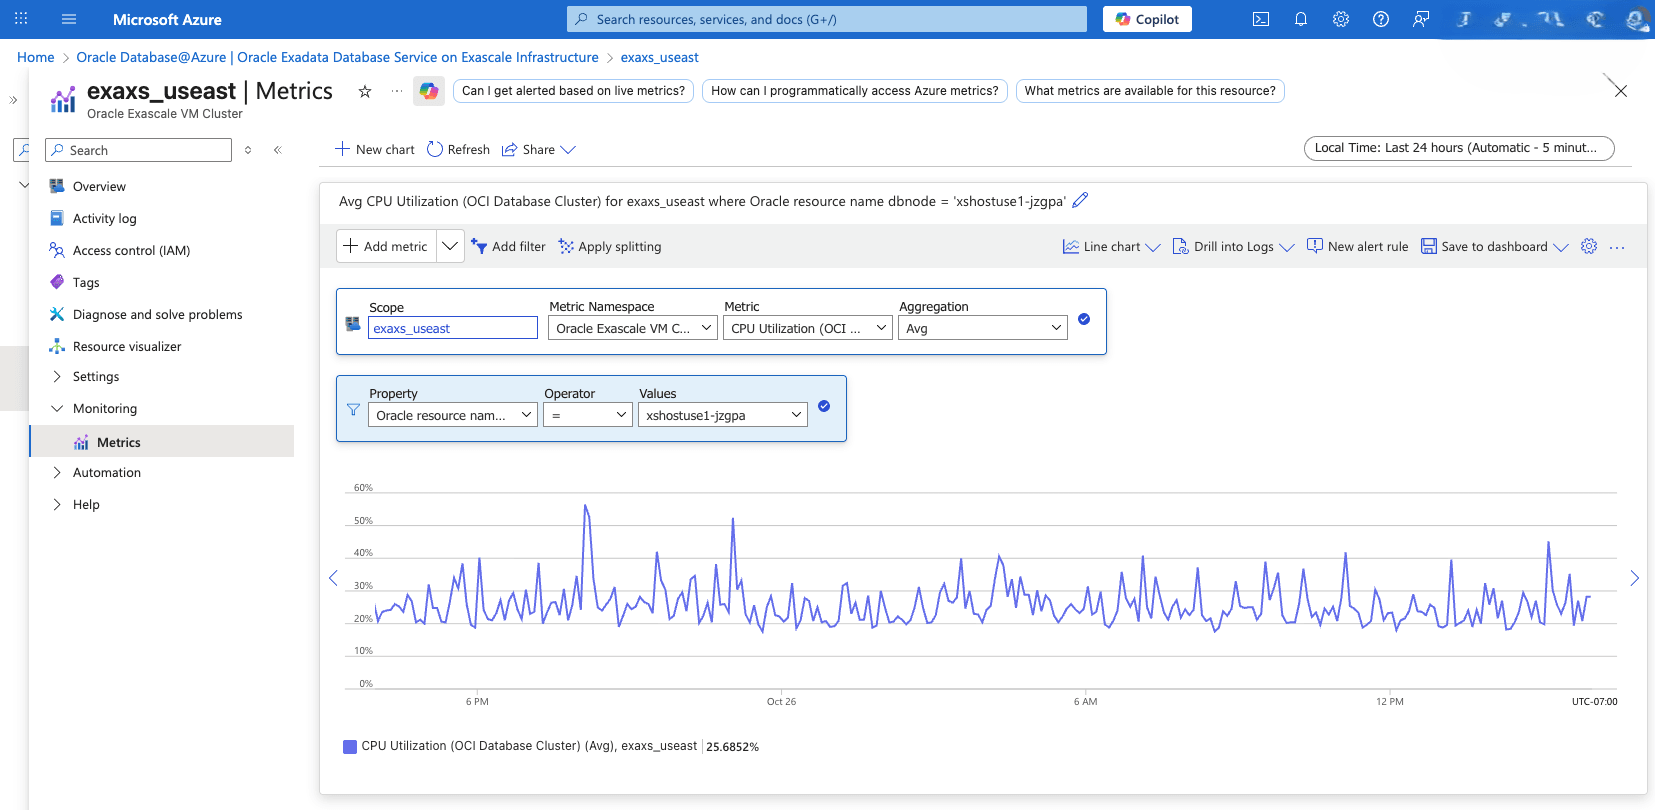
View Exascale Container Database Metrics- From the Azure portal, select Oracle AI Database@Azure.
- From the left menu, select Oracle Exadata Database Service on Exascale Infrastructure, and then select the VM Clusters tab.
- From the list, select your VM Cluster that you want to monitor.
- From the left menu, expand the Monitoring section, and then select Metrics.
- From the Metric dropdown list, select OCI Database for the Container Database metrics.
- If you have more than one Container Database, you can filter metrics by setting Property to Oracle Resource Name Database, Operator to =, and Values to your Container Database name.
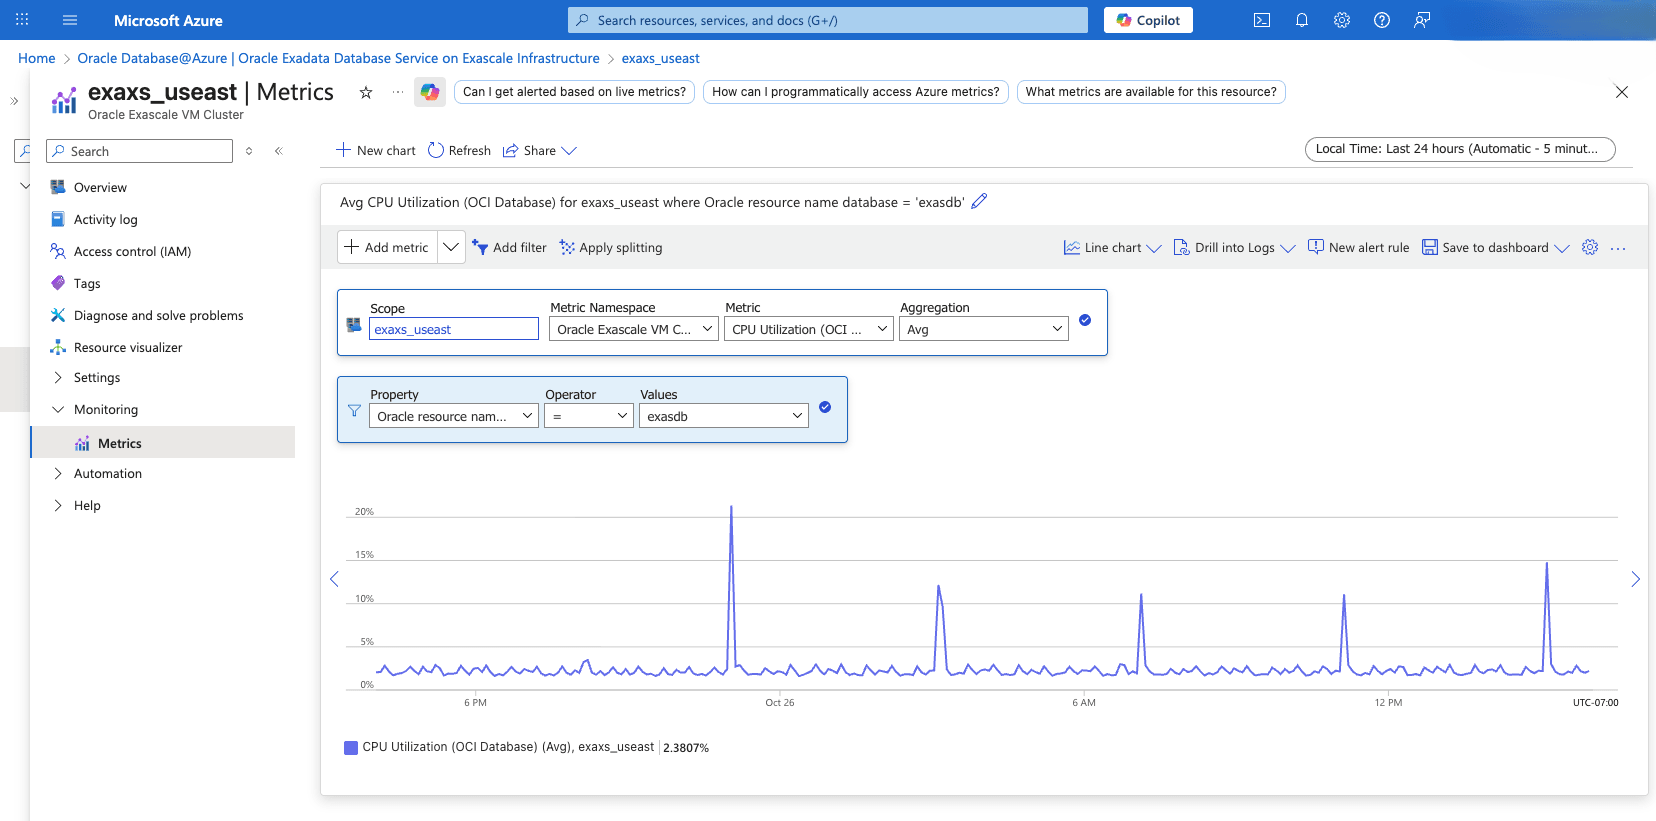
View Base Database Pluggable Database Metrics- To view Pluggable Database metrics, navigate to the OCI console and enable the Diagnostics & Managementoption in Database Management. For more information, see Enable Database Management for a Pluggable Database.
Table 1-5 Observability Metrics for Oracle Exadata Database Service on Exascale Infrastructure
Name Description Unit CPU Utilization (OCI Database Cluster) Percent CPU utilization Percent Filesystem Utilization Percent utilization of provisioned filesystem Percent Load Average System load average over 5 minutes Count Memory Utilization Percentage of memory available for starting new applications, without swapping. The available memory can be obtained via the following command: cat /proc/meminfo Percent Node Status Indicates whether the host is reachable. Count OCPU Allocated The number of OCPUs allocated Count Swap Utilization Percent utilization of total swap space Percent CPU Utilization (OCI Database) The CPU utilization expressed as a percentage, aggregated across all consumer groups. The utilization percentage is reported with respect to the number of CPUs the database is allowed to use. Percent Storage Utilization The percentage of provisioned storage capacity currently in use. Represents the total allocated space for all tablespaces. Percent DB Block Changes The Average number of blocks changed per second. CountPerSecond Execute Count The number of user and recursive calls that executed SQL statements during the selected interval. Count Current Logons The number of successful logons during the selected interval. Count Transaction Count The combined number of user commits and user rollbacks during the selected interval. Count User Calls The combined number of logons, parses, and execute calls during the selected interval. Count Parse Count The number of hard and soft parses during the selected interval. Count Storage Space Used Total amount of storage space used by the database at the collection time. Bytes Storage Space Allocated Total amount of storage space allocated to the database at the collection time Bytes Storage Space Used By Tablespace Total amount of storage space used by tablespace at the collection time. In case of container database, this metric provides root container tablespaces. Bytes Allocated Storage Space By Tablespace Total amount of storage space allocated to the tablespace at the collection time. In case of container database, this metric provides root container tablespaces. Bytes Storage Space Utilization By Tablespace This indicates the percentage of storage space utilized by the tablespace at the collection time. In case of container database, this metric provides root container tablespaces.. Percent
Azure and OCI use different methods for aggregating metrics. For more information, see Azure Monitor Metrics aggregation and display explained.
Build and Monitor Custom Dashboards Using Azure Monitor
The Azure Monitor dashboard provides a unified and customizable interface for monitoring Oracle AI Database@Azure environments. You can use this dashboard to visualize real-time metrics, logs, and alerts related to your Oracle AI Database@Azure resources.
The dashboard enables you to track key performance indicators, monitor resource utilization, and check application health. Integration with other Azure services is supported, allowing you to centralize monitoring and manage Oracle AI Database@Azure deployments more efficiently.
Create a Custom Dashboard
- From the Azure portal, navigate to Dashboard hub.
- Select the + Create button, and then select the Custom option. This opens the Tile Gallery, where you can select tiles to display various types of information. An empty grid representing your dashboard layout also appears, allowing you to organize the selected tiles as needed.
- Enter a descriptive name to help you easily identify your custom dashboard,and then select the Save button to save. Your dashboard now displays. Use the arrow next to the dashboard name to access other available dashboards, including those shared by other users.
- Select your dashboard from the dropdown list, and then select the Edit button from top action bar.
- Browse the Tile Gallery or use the Filter tiles to find specific tiles.
- Select the tile you want to add and then select the Add button. Alternatively, you can drag and drop it onto the grid.
- If you want to preview the layout before saving, select the Preview button. To save your changes, select the Save button to confirm your changes or the Cancel button to discard them, or the Edit button to continue modifying the layout.
- In the tile, select the (...) button in Metrics.
- In the Select a Scope window, select the Oracle AI Database@Azure resource you want to monitor, then select the Apply button.
- In the next window, validate the scope and metric namespace, then select the metric and aggregation method you want to monitor. Select the Save to dashboard button.
- To add more metrics to the dashboard, repeat steps 5–11.
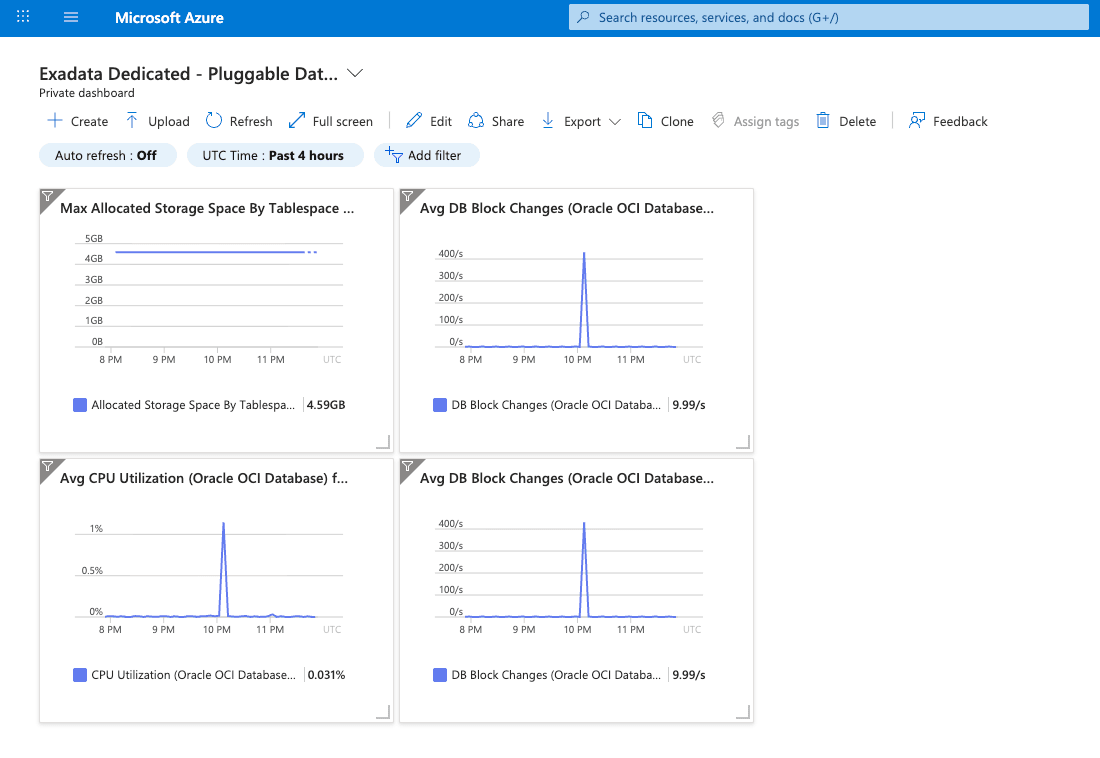
Configure Alert Policies and Notifications Monitor
This topic explains how to configure alert policies and notifications.
Create an Action Group
When Azure Monitor detects a potential issue in your infrastructure or application, it generates an alert. You can associate action groups with these alerts to enable a prompt response. An action group is a collection of notification settings and automated actions.
Action groups define who is notified and which actions are executed when an alert is triggered. They support notification channels such as voice calls, SMS, push notifications, and email. Automated actions, such as invoking a webhook or an Azure Function, are also supported. You can use action groups with services including Azure Monitor , Azure Service Health, and Azure Advisor.
- Type: The notification method or automation that is used.
- Name: A unique identifier for the action within the group.
- Details: Configuration settings that are specific to the selected action type.
- From the Azure portal, navigate to Monitor. The Monitor page displays all monitoring configurations and data in a single view.
- From the left menu, select Alerts, and then select Action groups.
- Select the + Create button from the top action bar.
- From the Basics tab of the Create action group flow, enter the following information.
- From the dropdown list, select the Subscription and the Resource group where the action group will be created.
- Select your preferred Region from the dropdown list.
Note
Azure Service Health Alerts are available only in public clouds within the Global region. While configuring Azure Service Health Alerts, select Global as the region for your action group to ensure full support and resiliency.- Global: The action group is geo-redundant, providing regional resiliency. Actions (such as voice, SMS, or email) are processed in any available Azure region.
- Regional: The action group is confined to your chosen region and is zone-redundant. This option is recommended for data residency or regulatory purposes.
- Enter a descriptive action group name in the Action group name field. The action group name must not contain characters from : < > + / & % ? @.
- Enter a descriptive display name in the Display name field. The display name is limited to 12 characters.
- Select the Next button to continue.
- From the Basics tab of the Create action group flow, enter the following information.
- From the dropdown list, select the Subscription and the Resource group where the action group will be created.
- Select your preferred Region from the dropdown list.
Note
Azure Service Health Alerts are available only in public clouds within the Global region. While configuring Azure Service Health Alerts, select Global as the region for your action group to ensure full support and resiliency.- Global: The action group is geo-redundant, providing regional resiliency. Actions (such as voice, SMS, or email) are processed in any available Azure region.
- Regional: The action group is confined to your chosen region and is zone-redundant. This option is recommended for data residency or regulatory purposes.
- Enter a descriptive action group name in the Action group name field. The action group name must not contain characters from : < > + / & % ? @.
- Enter a descriptive display name in the Display name field. The display name is limited to 12 characters. The display name is used in notifications.
- Select the Next button to continue.
- From the Notifications tab of the Create action group flow, enter the following information.
- From the dropdown list, select Notification type and add recipients in the Name field.
- From the dropdown list, select Azure Resource Manager Role.
- Enable the common alert schema for a consistent and unified payload across alert services.
- Select OK to save the changes.
Note
- Azure Resource Manager Role: Send emails to users based on their role assignments.
- Email: Enter the recipient’s email address.
- SMS: Provide country code and phone number.
Note
SMS is not supported in all regions - Azure app push notifications: Specify the Azure account email for mobile app alerts.
- Voice: Enter phone details (region permitting).
- Select the Next button to continue.
- From the dropdown list, select Notification type and add recipients in the Name field.
- From the Actions tab of the Create action group flow, enter the following information. This section is optional.
- For each actions, select Action type from the dropdown list, and then provide a Name.
Note
Action types include:- Automation Runbook: Automate remedial tasks.
- Event Hubs: Integrate with data streaming services.
- Functions: Trigger Azure Functions via HTTP endpoints.
- ITSM: Integrate with IT Service Management systems.
- Logic Apps: Build custom workflows to process alerts.
- Webhook/Secure Webhook: Send alert data to external endpoints. (For secure webhooks, use Microsoft Entra ID for authentication).
- Select the Next button to continue.
- For each actions, select Action type from the dropdown list, and then provide a Name.
- From the Tags tab of the Create action group flow, enter the following information. Tags are name-value pairs that allow you to categorize resources and view consolidated billing by applying the same tag to multiple resources and resource groups. This section is optional.
- For each tag, enter a Name and then provide a Value.
- Select the Next button to continue.
- From the Review + create tab of the Create action group flow, review the settings you have selected. If any changes are needed, select the Previous button. Once you complete, select the Create button to create your action group. If you want to stop the creation process, select the Cross button.
- From the Azure portal, navigate to Monitor. The Monitor page displays all monitoring configurations and data in a single view.
- From the left menu, select Alerts, and then select Alert rules.
- Select the + Create button from the top action bar.
- From the Scope tab of the Create an alert rule flow, enter the following information.
- From the dropdown list, select Scope level.
- From the + Select scope section, select the resource(s) which you want the alert rule to monitor.
- Select the Next button to continue.
- From the Condition tab of the Create an alert rule flow, enter the following information.
- Select the Signal name (metric) that will trigger the alert.
- Set the logic for the alert, such as the threshold and evaluation period.
- Select the Next button to continue.
- From the Actions tab of the Create an alert rule flow, enter the following information.
- Choose the preferred option from the Select actions.
- Use quick actions (preview): This option is for selecting one or more of the quick actions.
- Use action groups: This option is for adding an existing action group or creating a new one.
- None: This option is for not selecting any actions.
- Select the Next button to continue.
- Choose the preferred option from the Select actions.
- From the Details tab of the Create an alert rule flow, review the details, and then select the Next button to continue.
- From the Tags tab of the Create an alert rule flow, enter the following information. Tags are name-value pairs that allow you to categorize resources and view consolidated billing by applying the same tag to multiple resources and resource groups. This section is optional.
- For each tag, enter a Name and then provide a Value.
- Select the Next button to continue.
- From the Review + create tab of the Create an alert rule flow, review the settings you have selected. If any changes are needed, select the Previous button. Once you complete, select the Create button to create your alert rule. If you want to stop the creation process, select the Cross button.