Google Cloud Observability
Google Cloud Observability gives you the visibility to understand the health, behavior, and performance of your Oracle Database@Google Cloud.
At its core, observability means collecting and analyzing telemetry data — metrics, logs, traces, and other signals from your Oracle Database@Google Cloud infrastructure. This data tells the real-time story of health and performance.
When you create a Google Cloud project, the following services are enabled by default.
- Cloud Monitoring
- Cloud Logging
- Cloud Trace
Exadata VM Cluster Metrics
- Obtain the Exadata VM Cluster ID.
- Navigate to the Oracle Database@Google Cloud Console.
- Select the Dedicated Infrastructure under Exadata Database Service.
- Select Exadata VM Clusters.
- Copy the Cluster ID from this page. You need this information in the Google Cloud Monitoring console.
- View the Exadata VM Cluster metrics.
- Go to the Cloud Monitoring metrics explorer page in the Google Cloud console.
- Go to Metrics explorer
- In the Queries section, select Select a metric, and choose Cloud VM Cluster to view its metrics.
- Select an active metric and then select the Apply.
- Filter with “Cloud_VM_CLUSTER_ID” equals to the Cluster ID obtained from previous step.
- The metric is displayed. You can view your metric as a chart, table, or both by selecting the option in the results pane.
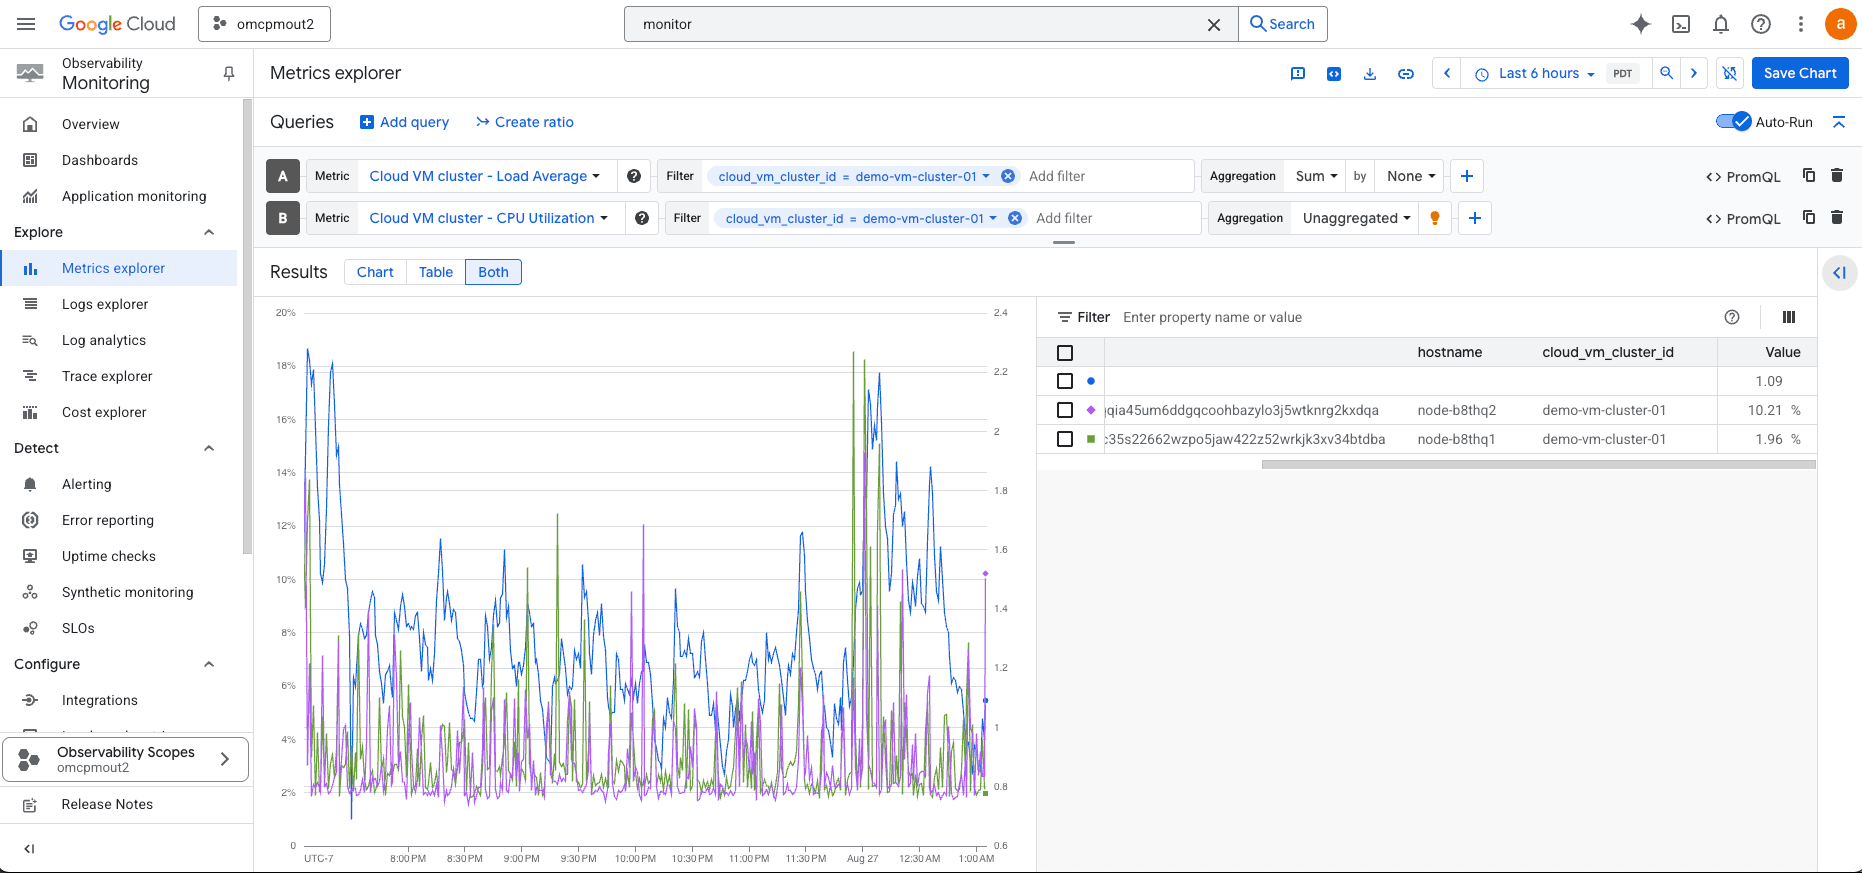
Observability metrics for Exadata VM Clusters
| Name | Description | Unit |
| ASM Diskgroup Utilization | Percentage of usable space used in a Disk Group. Usable space is the space available for growth. DATA disk group stores our Oracle database files. RECO disk group contains database files for recovery such as archives and flashback logs. | percentage |
| CPU Utilization | Percent CPU utilization of CloudVmCluster. | percentage |
| Filesystem Utilization | Percent utilization of provisioned filesystem. | percentage |
| Load Average | System load average over 5 minutes. | Integer |
| Memory Utilization | Percentage of memory available for starting new applications, without swapping. | percentage |
| Node Status | Indicates whether the host is reachable. | Integer |
| OCPU Allocated | The number of OCPUs allocated. | Integer |
| Swap Utilization | Percent utilization of total swap space. | percentage |
Exadata Container Database Metrics
- Obtain the Exadata Container Database Name
- Navigate to the Oracle Database@Google Cloud Console.
- Select the Dedicated Infrastructure under Exadata Database Service.
- Select Exadata VM Clusters.
- Select Manage in OCI. This takes you to the Exadata VM Cluster page.
- Select the Databases tab and select your respective Database.
- From the Database Information page, you can select the OCID.
- Copy that as we need this information in the Google Cloud Monitoring console.
- View the Exadata Container Database Metrics
- Go to the Cloud Monitoring metrics explorer page in the Google Cloud console. For more information, see Go to Metrics explorer
- In the Queries section, select Select a metric, and choose resource names to view metrics for that resource: Container Database. Select an active metric and then select the Apply button.
- Filter the same with resource_ID as the OCID of the container database.
- The metric is displayed. You can view your metric as a chart, table, or both by selecting the option in the results pane.
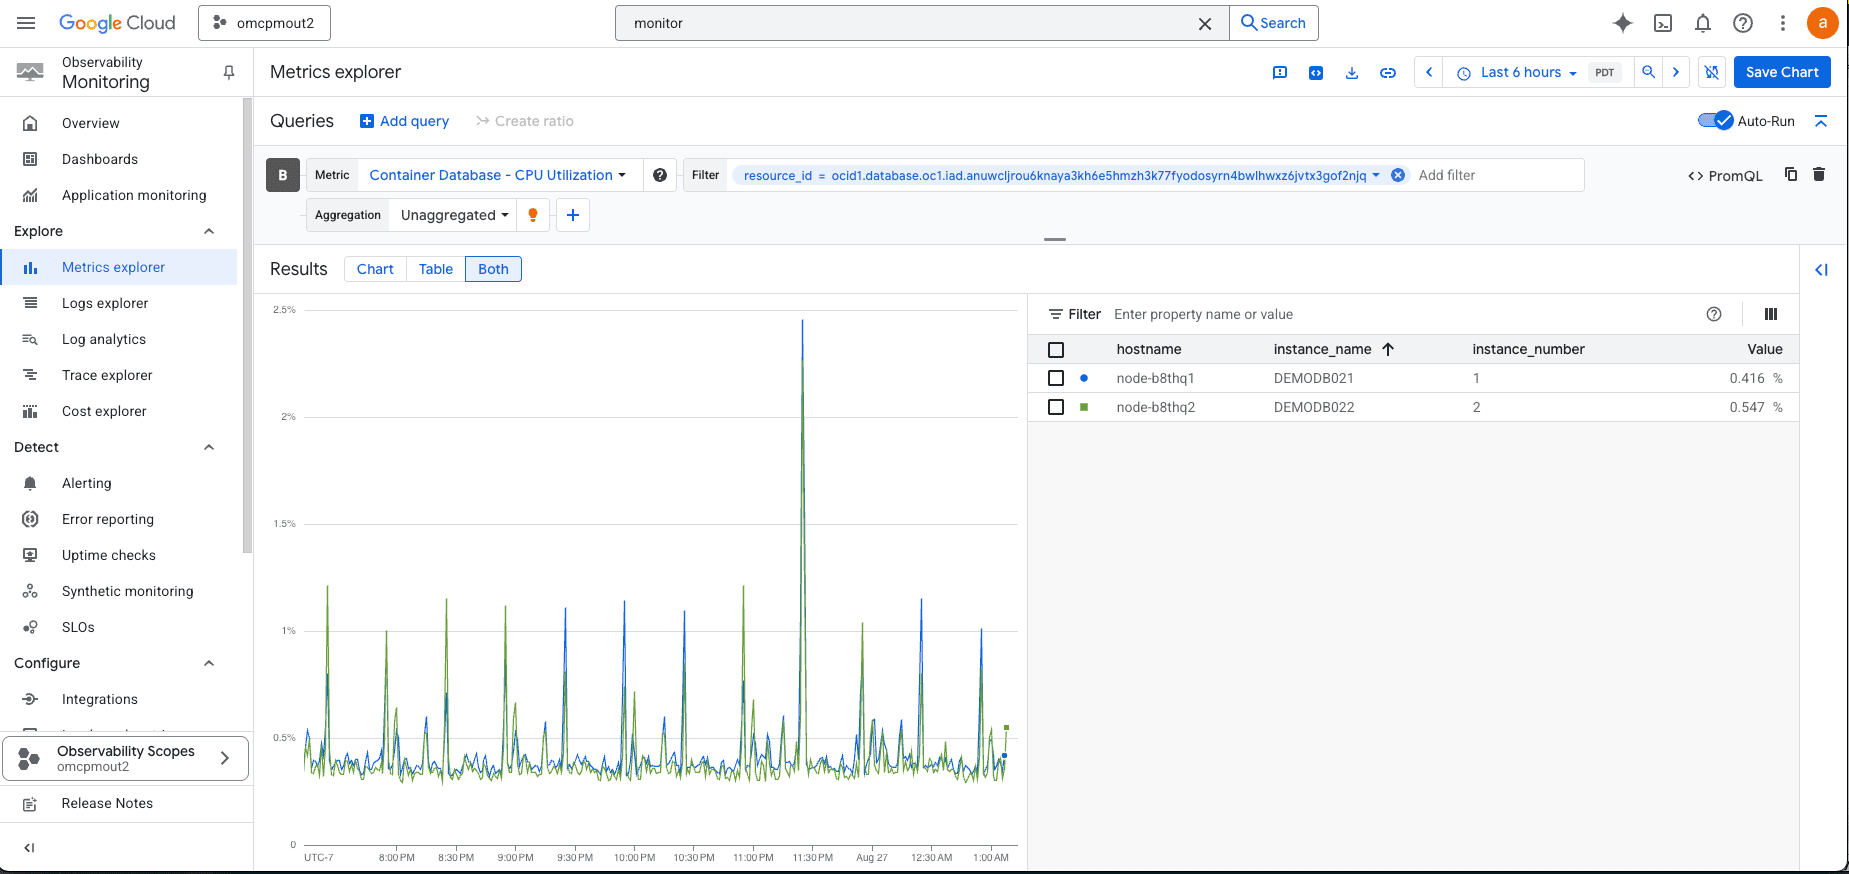
Observability metrics for Exadata Container Databases
| Name | Description | Unit |
| Allocated Storage Space By Tablespace | Total amount of storage space allocated to the tablespace at the collection time. In case of container database, this metric provides root container tablespaces. | GB |
| CPU Utilization | Percent CPU utilization of container database. | percentage |
| Current Logons | The number of successful logons during the selected interval. | Count |
| DB Block Changes | Changes per second. | Changes/sec |
| Execute Count | The number of user and recursive calls that executed SQL statements during the selected interval. | Count |
| Parse Count | The number of hard and soft parses during the selected interval. | Count |
| Storage Space Allocated | Total amount of storage space allocated to the database at the collection time. | GB |
| Storage Space Used | Total amount of storage space used by the database at the collection time. | GB |
| Storage Space Used By Tablespace | Total amount of storage space used by tablespace at the collection time. In case of container database, this metric provides root container tablespaces. | GB |
| Storage Space Utilization By Tablespace | This indicates the percentage of storage space utilized by the tablespace at the collection time. In case of container database, this metric provides root container tablespaces. | GB |
| Storage Utilization | The percentage of provisioned storage capacity currently in use. Represents the total allocated space for all tablespaces. | percentage |
| Transaction Count | The combined number of user commits and user rollbacks during the selected interval. | Count |
| User Calls | The combined number of logons, parses, and execute calls during the selected interval. | Count |
Pluggable Database Metrics
To view the pluggable database metrics, navigate to the OCI console and enable the Database management (Diagnostics & Management) to view the metrics. Refer to this link to enable Database Management for a Pluggable Database.
Autonomous AI Database Metrics
- Obtain the Autonomous AI Database ID
- Navigate to the Oracle Database@Google Cloud Console.
- Select the Autonomous AI Database under Autonomous AI Database Services.
- Select Autonomous AI Database you want to monitor.
- Copy the Database ID from this page. You need this information in the Google Cloud Monitoring console.
- View the Autonomous AI Database Metrics
- Go to the Cloud Monitoring metrics explorer page in the Google Cloud console. For more information, see Go to Metrics explorer
- In the Queriessection, select Select a metric, and choose resource names to view metrics for that resource: Autonomous AI Database.
- Select an active metric and then select the Apply button.
- Filter the same with
autonomous_database_idas the Database ID of the Autonomous AI Database. - The metric is displayed. You can view your metric as a chart, table, or bothby selecting the option in the results pane.
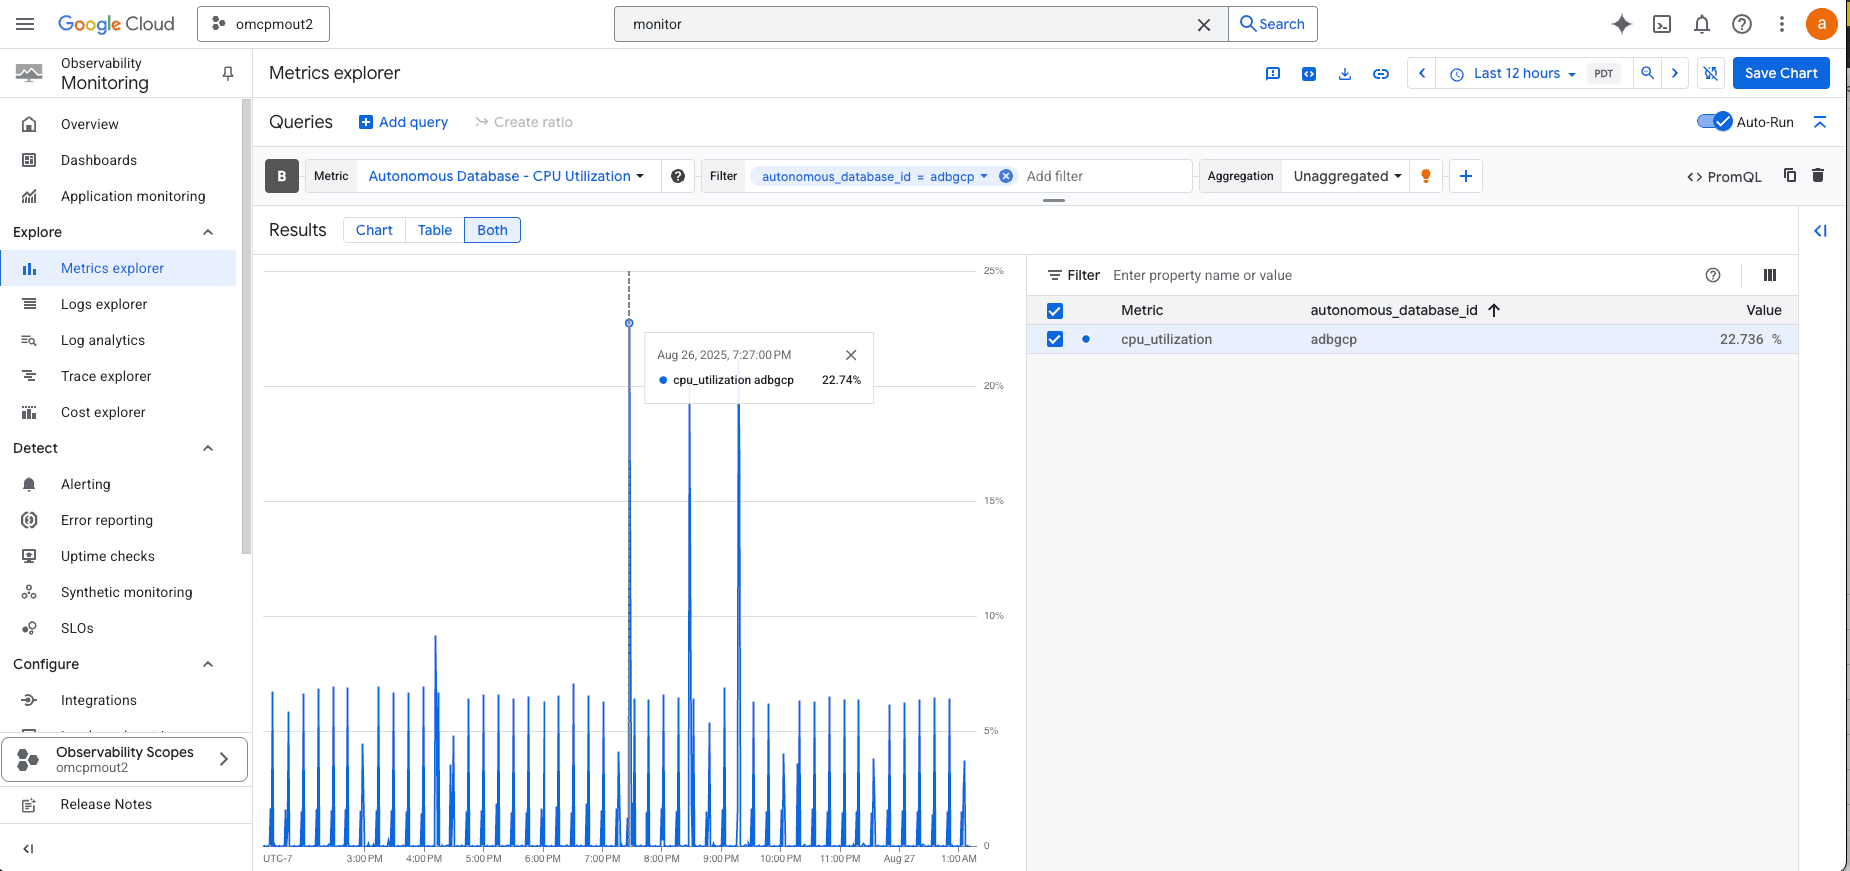
Observability metrics for Autonomous AI Databases
| Name | Description | Unit |
| Active APEX Applications | Displays the number of active APEX applications over the time interval. | count |
| APEX Page Events | Displays the number of page events over time. | count |
| APEX Page Load Time | Average APEX page execution time over the time interval. | seconds |
| APEX Workspace Count | Displays the number of APEX workspaces over the time interval. | count |
| Average Active Sessions | The average number of sessions that are actively executing or waiting for resources. | count |
| Blocking Sessions | The number of current blocking sessions. | count |
| Bytes Received via SQL*Net from Client | The number of bytes received from the client over Oracle Net Services, during the selected time interval. | count |
| Bytes Received via SQL*Net from DBLink | The number of bytes received from a database link over Oracle Net Services, during the selected time interval. | count |
| Bytes Sent via SQL*Net to Client | The number of bytes sent to the client from the foreground processes, during the selected time interval. | count |
| Bytes Sent via SQL*Net to DBLink | The number of bytes sent over a database link, during the selected time interval. | count |
| Connection Latency | The time taken to connect to an Oracle Autonomous AI Database Serverless instance in each region from a Compute service virtual machine in the same region. | Milliseconds |
| CPU Time | Average rate of accumulation of CPU time by foreground sessions in the database over the time interval. | seconds per second |
| CPU Utilization | The CPU usage expressed as a percentage, aggregated across all consumer groups. The utilization percentage is reported with respect to the number of CPUs the database is allowed to use. | percent |
| Current Logons | The number of successful logons during the selected interval. | count |
| Database Availability | The database is available for connections in the given minute, with possible values. 1 = DB Available, 0 = DB Unavailable. | count |
| DB Block Changes | The number of changes that were part of an update or delete operation that were made to all blocks in the SGA. Such changes generate redo log entries and thus become permanent changes to the database if the transaction is committed. This approximates total database work. This statistic indicates the rate at which buffers are being dirtied, during the selected time interval. | count |
| DB Time | The amount of time database user sessions spend executing database code (CPU Time + WaitTime). DB Time is used to infer database call latency, because DB Time increases in direct proportion to both database call latency (response time) and call volume. It is calculated as the average rate of accumulation of database time by foreground sessions in the database over the time interval. | seconds per second |
| Execute Count | The number of user and recursive calls that executed SQL statements during the selected interval. | count |
| Failed Logons | The number of log ons that failed because of an invalid user name and/or password, during the selected interval. | count |
| Maximum Storage Space | Maximum amount of storage reserved for the database during the interval. | GB |
| Parse Count (Failures) | The number of parse failures during the selected time interval. | count |
| Parse Count (Hard) | The number of parse calls (real parses) during the selected time interval. A hard parse is an expensive operation in terms of memory use, because it requires Oracle to allocate a workheap and other memory structures and then build a parse tree. | count |
| Parse Count (Total) | The number of hard and soft parses during the selected interval. | count |
| Peer Lag | The total time in seconds by which the Disaster Recovery peer lags behind its Primary database. | Seconds |
| Physical Read Total Bytes | The size in bytes of disk reads by all database instance activity including application reads, backup and recovery, and other utilities, during the selected time interval. | count |
| Physical Writes | The number of data blocks written to disk, during the selected time interval. | count |
| Query Latency | The time taken to display the results of a simple query on the user's screen. | Milliseconds |
| Queued Statements | The number of queued SQL statements, aggregated across all consumer groups, during the selected interval. | count |
| Redo Generated | Amount of redo generated in bytes, during the selected time interval. | count |
| Running Statements | The number of running SQL statements, aggregated across all consumer groups, during the selected interval. | count |
| Session Logical Reads | The sum of "db block gets" plus "consistent gets", during the selected time interval. This includes logical reads of database blocks from either the buffer cache or process private memory. | count |
| Session Utilization | The maximum session utilization expressed as a percentage, aggregated across all consumer groups. | percentage |
| Sessions | The number of sessions in the database. | count |
| Storage Space Allocated | Amount of space allocated to the database for all tablespaces, during the interval. | GB |
| Storage Space Used | Maximum amount of space used during the interval. | GB |
| Storage Utilization | The percentage of the reserved maximum storage currently allocated for all database tablespaces. Represents the total reserved space for all tablespaces. | percentage |
| Transaction Count | The combined number of user commits and user rollbacks during the selected interval. | count |
| User Calls | The combined number of logons, parses, and execute calls during the selected interval. | count |
| User Commits | The number of user commits during the selected time interval. When a user commits a transaction, the generated redo that reflects the changes made to database blocks must be written to disk. Commits often represent the closest thing to a user transaction rate. | count |
| User Rollbacks | Number of times users manually issue the ROLLBACK statement or an error occurs during a user's transactions, during the selected time interval. | count |
| Wait Time | Average rate of accumulation of non-idle wait time by foreground sessions in the database over the time interval. | seconds per second |
Base Database Metrics
- Obtain the Information
- Navigate to the Oracle Database@Google Cloud Console.
- Select the Base Database under Base Database Service.
- Select the following attributes of the Base Database depending on what you want to monitor.
- Hostname prefix - If you want to monitor the metrics of the Node hosting the Base DB or the ExaDB VM Cluster metrics.
- Database Unique Name - if you want to monitor the Metrics of the Container Database
- Copy the above information from this page. You need this information in the Google Cloud Monitoring console.
- View the Metrics
- Go to the Cloud Monitoring metrics explorer page in the Google Cloud console. Go to Metrics explorer
- In the Queries section, select Select a metric, and choose resource names to view metrics for that resource:
- DbSystem Container Database and select an active metric and the select the Apply button. Filter with instance_name. Use the Database Unique Name from above. This will show the Container Database Metrics.
- DbSystem and select an active metric and the select the Apply button. Filter with Hostname. Use the Hostname prefix from above. This will show the Host metrics.
- The metric is displayed. You can view your metric as a chart, table, or both by selecting the option in the results pane.
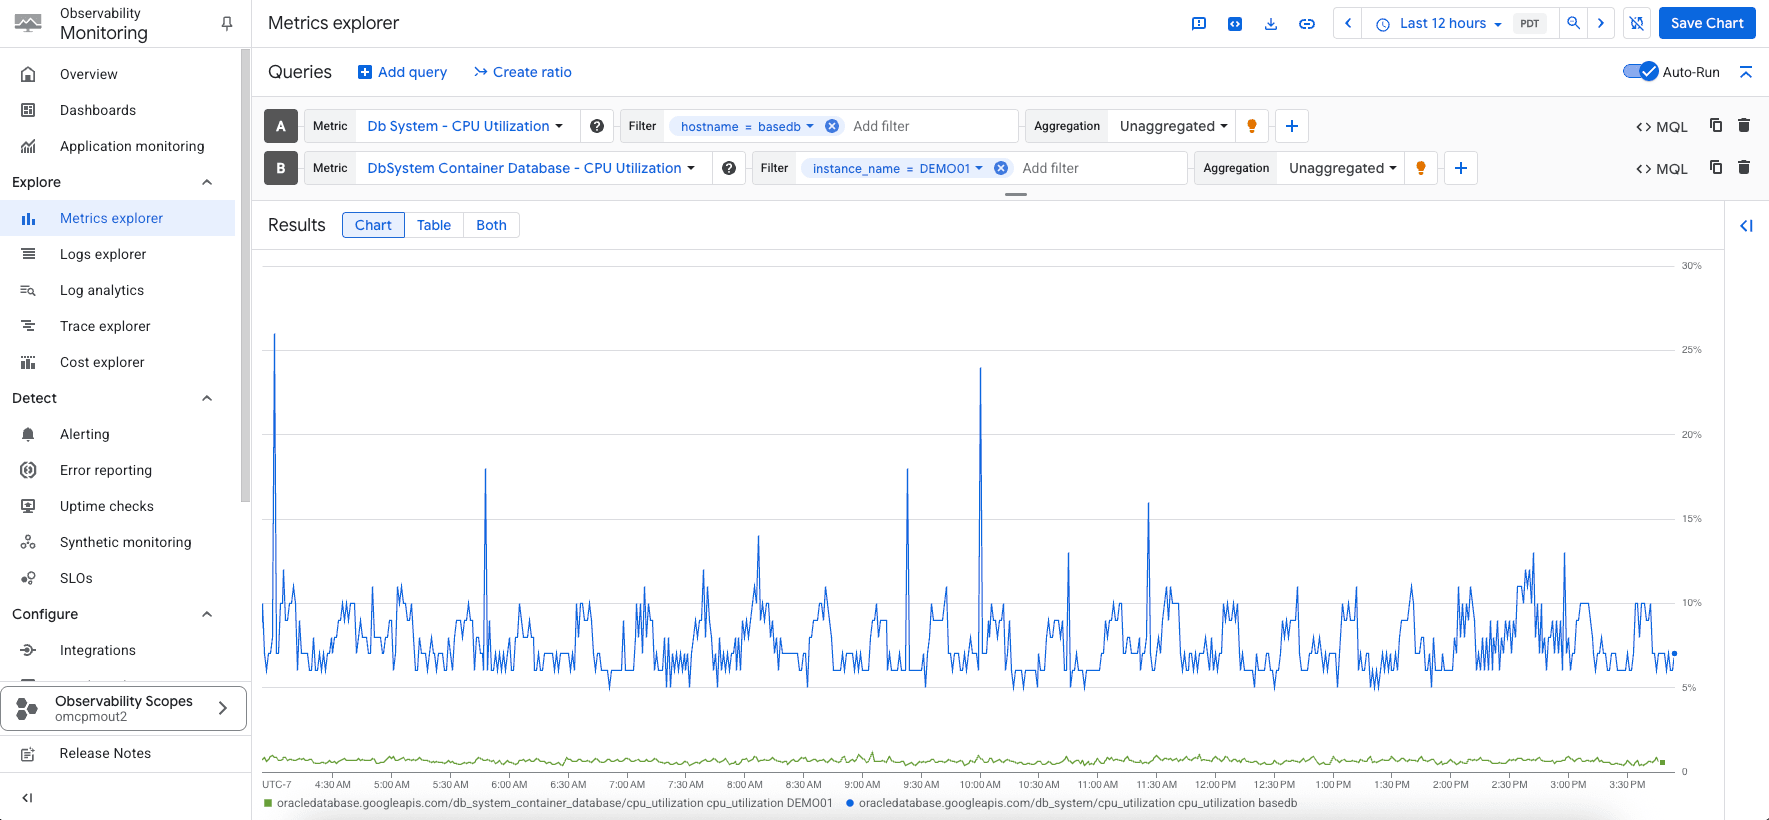
Observability metrics for Base Databases
| Name | Description | Unit |
| Allocated Storage Space By Tablespace | Total amount of storage space allocated to the tablespace at the collection time. In case of container database, this metric provides root container tablespaces. | GB |
| CPU Utilization | The CPU utilization expressed as a percentage, aggregated across all consumer groups. The utilization percentage is reported with respect to the number of CPUs the database is allowed to use, which is two times the number of OCPUs. | percentage |
| DB Block Changes | The Average number of blocks changed per second. | Changes per second |
| Execute Count | The number of user and recursive calls that executed SQL statements during the selected interval. | Count |
| Parse Count | The number of hard and soft parses during the selected interval. | Count |
| Storage Space Allocated | Total amount of storage space allocated to the database at the collection time. | GB |
| Storage Space Used | Total amount of storage space used by the database at the collection time. | GB |
| Storage Used By Tablespace | Total amount of storage space used by tablespace at the collection time. In case of container database, this metric provides root container tablespaces. | GB |
| Storage Utilization | The percentage of provisioned storage capacity currently in use. Represents the total allocated space for all tablespaces. | percentage |
| Storage Utilization By Tablespace | This indicates the percentage of storage space utilized by the tablespace at the collection time. In case of container database, this metric provides root container tablespaces. | percentage |
| Transaction Count | The combined number of user commits and user rollbacks during the selected interval. | Count |
| User Calls | The combined number of logons, parses, and execute calls during the selected interval. | Count |
Observability metrics for Base Database Systems
| Name | Description | Unit |
| CPU Utilization | Percent CPU utilization. | percentage |
| Filesystem Utilization | Percent utilization of provisioned filesystem. | percentage |
| Load Average | System load average over 5 minutes. | integer |
| Memory Utilization | Percentage of memory available for starting new applications, without swapping. | percentage |
| Node Status | Indicates whether the host is reachable. | integer |
| OCPUs Allocated | The number of OCPUs allocated. | integer |
| Swap Utilization | Percent utilization of total swap space. | percentage |
Pluggable Database Metrics
To view the pluggable database metrics, navigate to the OCI console and enable the Database management (Diagnostics & Management) to view the metrics. Refer to this link to enable Database Management for a Pluggable Database.
Exascale Infrastructure Metrics
- Obtain the Information
- Navigate to the Oracle Database@Google Cloud Console.
- Select the Exascale Infrastructure under Exadata Database Service.
- Select and copy the Cluster ID of the VM Cluster you want to monitor . You need this information in the Google Cloud Monitoring console.
- View the Metrics
- Go to the Cloud Monitoring metrics explorer page in the Google Cloud console. Go to Metrics explorer
- In the Queries section, select Select a metric, and choose resource names to view metrics for that resource.
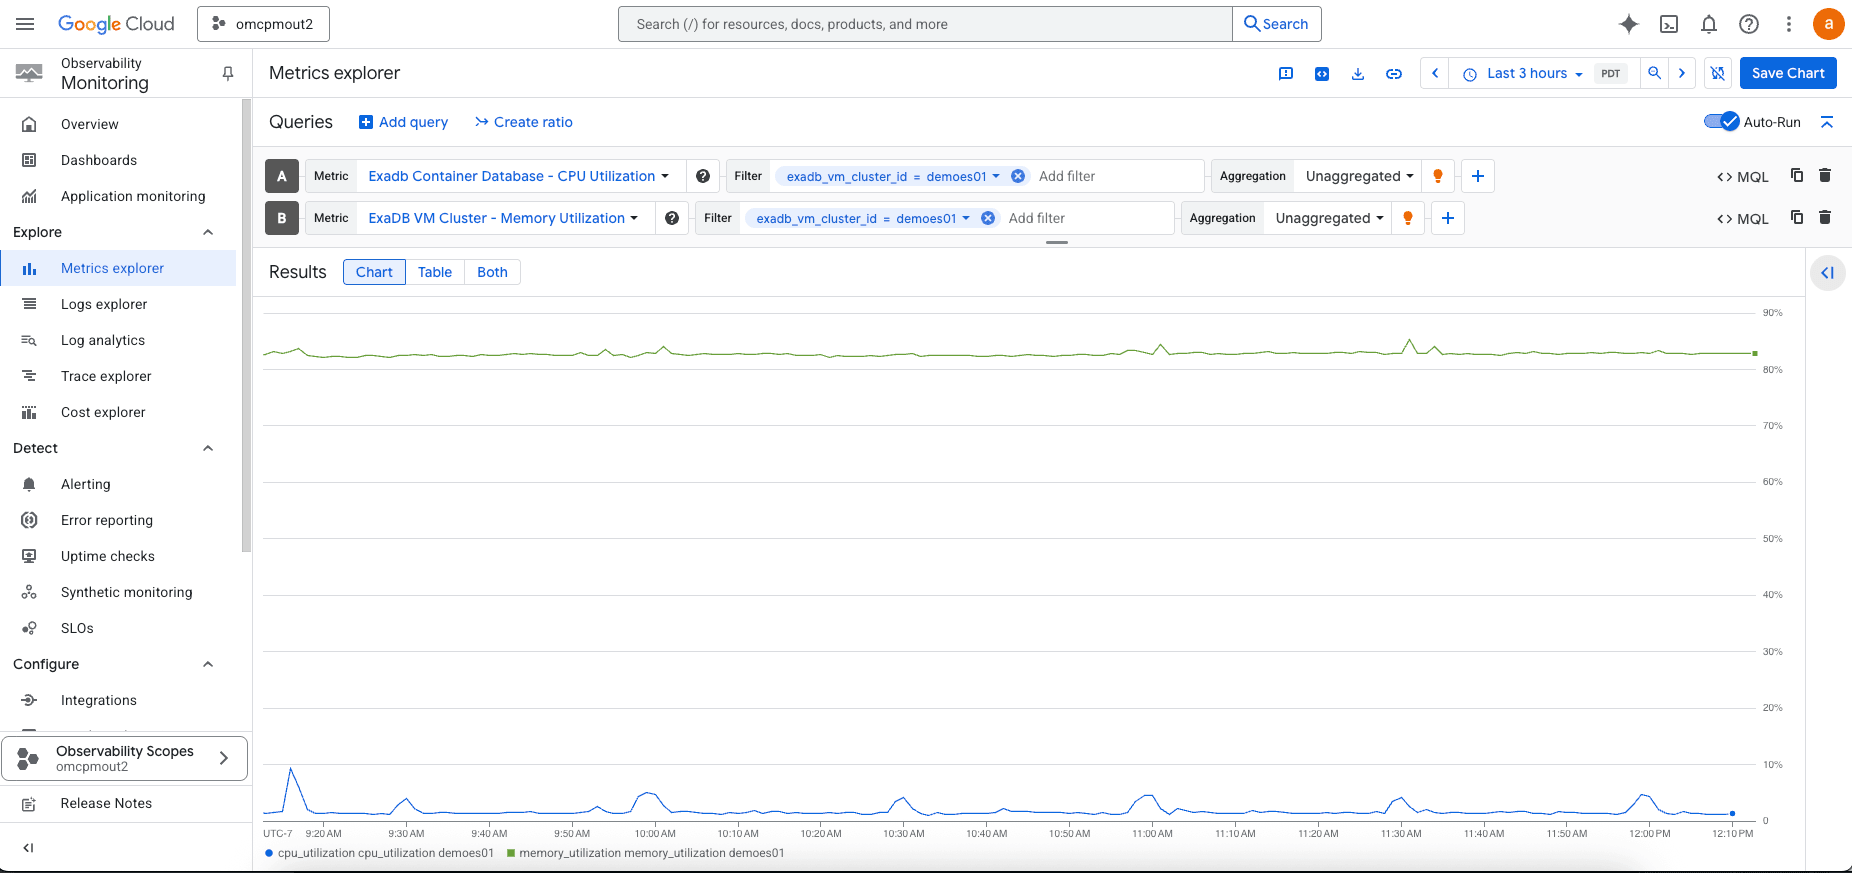
- ExaDB VM Cluster and select an active metric and then select the Apply button. Filter with exadb_vm_cluster_id. Use the Cluster_ID copied from above. This will show the VM cluster Metrics.
- ExaDB Container Database and select an active metric and then select the Apply button. Filter with exadb_vm_cluster_id. Use the Cluster_ID copied from above.. This will show the Container Database metrics.
- The metric is displayed. You can view your metric as a chart, table, or both by selecting the option in the results pane.
Observability metrics for Exascale VM Clusters
| Name | Description | Unit |
| CPU Utilization | Percent CPU utilization of ExaDB VM Cluster. | percentage |
| Filesystem Utilization | Percent utilization of provisioned filesystem. | percentage |
| Load Average | System load average over 5 minutes. | integer |
| Memory Utilization | Percentage of memory available for starting new applications, without swapping. | percentage |
| Node Status | Indicates whether the host is reachable. | integer |
| Swap Utilization | Percent utilization of total swap space. | percentage |
Observability metrics for Container Databases (Exascale)
| Name | Description | Unit |
| CPU Utilization | The CPU utilization expressed as a percentage, aggregated across all consumer groups. Utilization is based on allowed CPUs. | percentage |
| Storage Utilization | The percentage of provisioned storage capacity currently in use; total allocated space for all tablespaces. | percentage |
| DB Block Changes | Average number of DB blocks changed per second. | Changes/sec |
| Execute Count | The number of user and recursive calls that executed SQL statements during the interval. | Count |
| Current Logons | Number of successful logons during the selected interval. | Count |
| Transaction Count | The combined number of user commits and user rollbacks during the interval. | Count |
| User Calls | Combined number of logons, parses, and execute calls during the interval. | Count |
| Parse Count | Number of hard and soft parses during the interval. | Count |
| Storage Space Used | Total amount of storage space used by the database at the collection time. | GB |
| Storage Space Allocated | Total storage allocated to the database at the collection time. | GB |
| Storage Space Used By Tablespace | Storage space used by tablespace at collection time (root container for container DB). | GB |
| Allocated Storage Space By Tablespace | Storage space allocated to tablespace at collection time (root container for container DB). | GB |
| Storage Space Utilization By Tablespace | Percentage of storage space utilized by tablespace at collection time (root container for container DB). | percentage |
Pluggable Database Metrics
To view the pluggable database metrics, navigate to the OCI console and enable the Database management (Diagnostics & Management) to view the metrics. Refer to this link to enable Database Management for a Pluggable Database.
Build Custom Dashboard and Monitor using Google Cloud Monitoring Dashboards
Google Cloud Monitoring Dashboard for Oracle Database@Google Cloud provides a centralized, customizable view of the health, performance, and availability of Oracle workloads running in Google Cloud. By collecting telemetry data such as metrics, logs, and traces from the Oracle Database infrastructure (VM clusters, ODB networks) and the Google Cloud environment (VPCs, Compute Engine, Cloud Interconnect), the dashboard allows teams to visualize database activity, detect anomalies, and troubleshoot issues in real time.
Create a Custom Dashboard and Monitor using Google Cloud Monitoring Dashboards
- Go to the Google Cloud Console, navigate to Observability Monitoring and select Dashboards.
- In the Dashboards Overview page, select Create Dashboard.
- select Add widget.
- In the Add widget pane, select a widget to add to your dashboard. For this example, select Metric.
- You can select a widget based on the type of data to display or how you want to display the data. In all cases, a configuration pane is opened. For example, you can select the Metric widget and then set the visualization to Stacked Or, you can select the Stacked area widget and then select the Metric.
- In the Configure widget page, select Select a metric drop-down menu and choose one of the following resource names to view metrics for that resource: Cloud VM Cluster, Autonomous AI Database, Container Database, or Pluggable Database.
- Under ACTIVE METRICS, select any metric you want to add in dashboard and select Apply.
- Select Apply to add the widget to the dashboard. This will add the widget to the dashboard.
- Repeat step 3 to 8 to add more widgets to the dashboard.
- Select the dashboard name and you can rename it.
- Go back to Dashboards Overview to see the list of dashboards.
- Select the newly created dashboard from the list of dashboards and change the time range to Today.
Example of a custom Dashboard
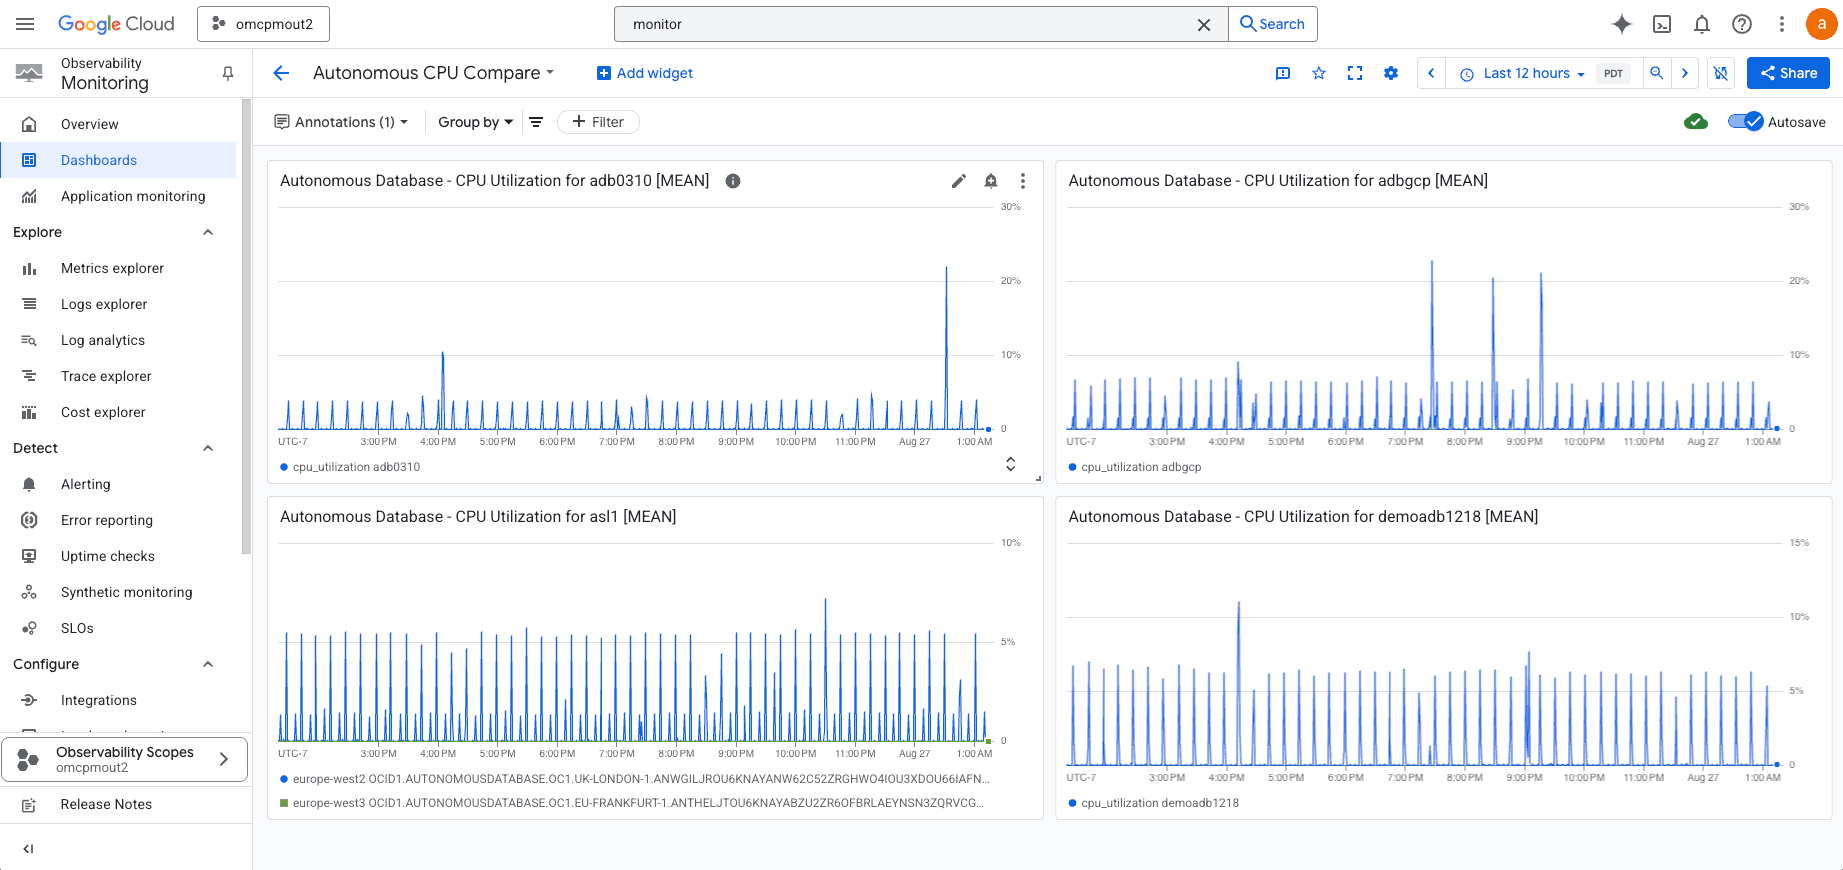
In the below example, a custom dashboard name “Autonomous CPU Compare” is created to compare the CPU Utilization of few Autonomous AI Databases in a certain timeframe.
Configure Alert Policies and Notifications
This section describes how you can get notified when any of the metrics of your Oracle Database@Google Cloud cross defined threshold or when the performance doesn't meet defined criteria.
The Cloud Monitoring alerting process contains three parts:
- An alerting policy, which describes the circumstances under which you want to be alerted and how you want to be notified about an incident. The alerting policy can monitor time-series data stored by Monitoring or logs stored by Cloud Logging. When that data meets the alerting policy condition, Monitoring creates an incident and sends the notifications.
- Each incident is a record of the type of data that was monitored and when the conditions were met. This information can help you troubleshoot the issues that caused the incident.
- A notification channel defines how you receive notifications when Monitoring creates an incident. For example, you can configure an alerting policy to email
my-suppport-team@rxample.comand to post a Slack message to the channel #my-support-team. An alerting policy can contain one or more notification channels.
Create a Notification channel
To add an email notification channel, do the following:
- In the Google Cloud console, go to the notifications Alerting page: Go to Alerting
- If you use the search bar to find this page, then select the result whose subheading is Monitoring.
- In the toolbar of the Google Cloud console, select your Google Cloud project.
- Select Edit notification channels.
- In the Email section, select Add new.
- Enter a single email address and a description.
- Select Save.
If you use a group email address as the notification channel for an alerting policy, then configure the group to accept mail from alerting-noreply@google.com.
You can create alerting policies to monitor different types of data depending on your alerting needs. The following sections list the different types of data that you can monitor with alerting policies.
Monitor time series data
| Condition Type | Description | Example |
|---|---|---|
| Metric-threshold condition |
Metric-threshold conditions are met when the values of a metric are more than, or less than, a threshold for a specific retest window. For more information, see Create metric-threshold alerting policies and Create alerting policies by using the API. |
You want an alerting policy that sends a notification when response latency is 500ms or higher for five consecutive uptime checks over 10 minutes. |
| Metric-absence condition |
Metric-absence conditions are met when a monitored time series has no data for a specific retest window. The maximum retest window is 23.5 hours. For more information, see Create metric-absence alerting policies and Create alerting policies by using the API. |
You want an alerting policy that opens an incident with your support team when a resource doesn't respond to any HTTP requests over the course of five minutes. |
| Forecasted metric-value condition |
Forecasted metric-value conditions are met when the alerting policy predicts that the threshold will be violated within the upcoming forecast window. The forecast window can range from 1 hour to 7 days. For more information, see Create forecasted metric-value alerting policies and Create alerting policies by using the API. |
You want an alerting policy that opens an incident with your support team when a resource is likely to reach 80% disk space usage within the next 24 hours. |
Create a custom alert
- Open Alerting
- In the Google Cloud Console, go to Monitoring → Alerting.
- Select the correct Google Cloud project
- Select Create Policy.
- Select a Metric
- Select Select a metric.
- Choose a resource type (e.g., Autonomous AI Database).
- Choose a metric type from Active Metrics (e.g., CPU utilization).
- Add filter (e.g., by resource_id or location ).
- Select Rolling window: Align metric values over a time window (e.g., 15 min). Select Next
- Configure the Trigger
- Leave Condition type = Threshold.
- Define the alert threshold:
- Example: Above 0.9 (CPU > 90%)
- Choose when the condition is met:
- Any time series violates (default)
- Percent of time series violate (e.g., 50% of nodes in cluster)
- To specify how Monitoring evaluates the condition when data stops arriving, expand Advanced options, and then use the Evaluation missing data
The Evaluation missing data menu is disabled when the value of the Retest window is No retest.
Google Cloud console"Evaluation of missing data" field Summary Details Missing data empty Open incidents stay open.
New incidents aren't opened.
For conditions that are met, the condition continues to be met when data stops arriving. If an incident is open for this condition, then the incident stays open. When an incident is open and no data arrives, the auto-close timer starts after a delay of at least 15 minutes. If the timer expires, then the incident is closed.
For conditions that aren't met, the condition continues to not be met when data stops arriving.
Missing data points treated as values that violate the policy condition Open incidents stay open.
New incidents can be opened.
For conditions that are met, the condition continues to be met when data stops arriving. If an incident is open for this condition, then the incident stays open. When an incident is open and no data arrives for the auto-close duration plus 24 hours, the incident is closed.
For conditions that aren't met, this setting causes the metric-threshold condition to behave like a metric-absence condition. If data doesn't arrive in the time specified by the retest window, then the condition is evaluated as met. For an alerting policy with one condition, the condition being met results in an incident being opened.
Missing data points treated as values that don't violate the policy condition Open incidents are closed.
New incidents aren't opened.
For conditions that are met, the condition stops being met when data stops arriving. If an incident is open for this condition, then the incident is closed.
For conditions that aren't met, the condition continues to not be met when data stops arriving.
- Configure the notification and add user labels.
- Expand the Notifications and name menu and select your notification channels created in the previous step. For redundancy purposes, we recommend that you add to an alerting policy multiple types of notification channels. For more information, see Manage notification channels.
- Optional: To use a custom subject line in your notification instead of the default, update the Notification subject line
- Optional: To be notified when an incident is closed, select Notify on incident closure. By default, when you create an alerting policy with the Google Cloud console, a notification is sent only when an incident is created.
- Optional: To change how long Monitoring waits before closing an incident after data stops arriving, select an option from the Incident autoclose duration By default, when data stops arriving, Monitoring waits seven days before closing an open incident.
- Select Alert name and enter a name for the alerting policy.
- Select Create policy.