Oracle Alloy Business Reporting
Oracle Alloy business reporting provides read-only dashboards in the Operator Console for cost and usage, order status, customer support metrics, and update activity. Oracle maintains these dashboards to give operators a consistent operating view for commercial review, support trending, and service-change awareness.
Alloy partners can also integrate the reporting data into third-party tooling for direct access and customization.
Access Business Reporting Dashboards from My Reports on the Operator Console home page or from Governance & Administration in the navigation menu. Each dashboard opens from a tile on the landing page. Report tabs within the dashboard provide more detailed views.
Best practice: Ensure when viewing reports that the data is refreshed first, using the refresh icon in the top right of the report toolbar.
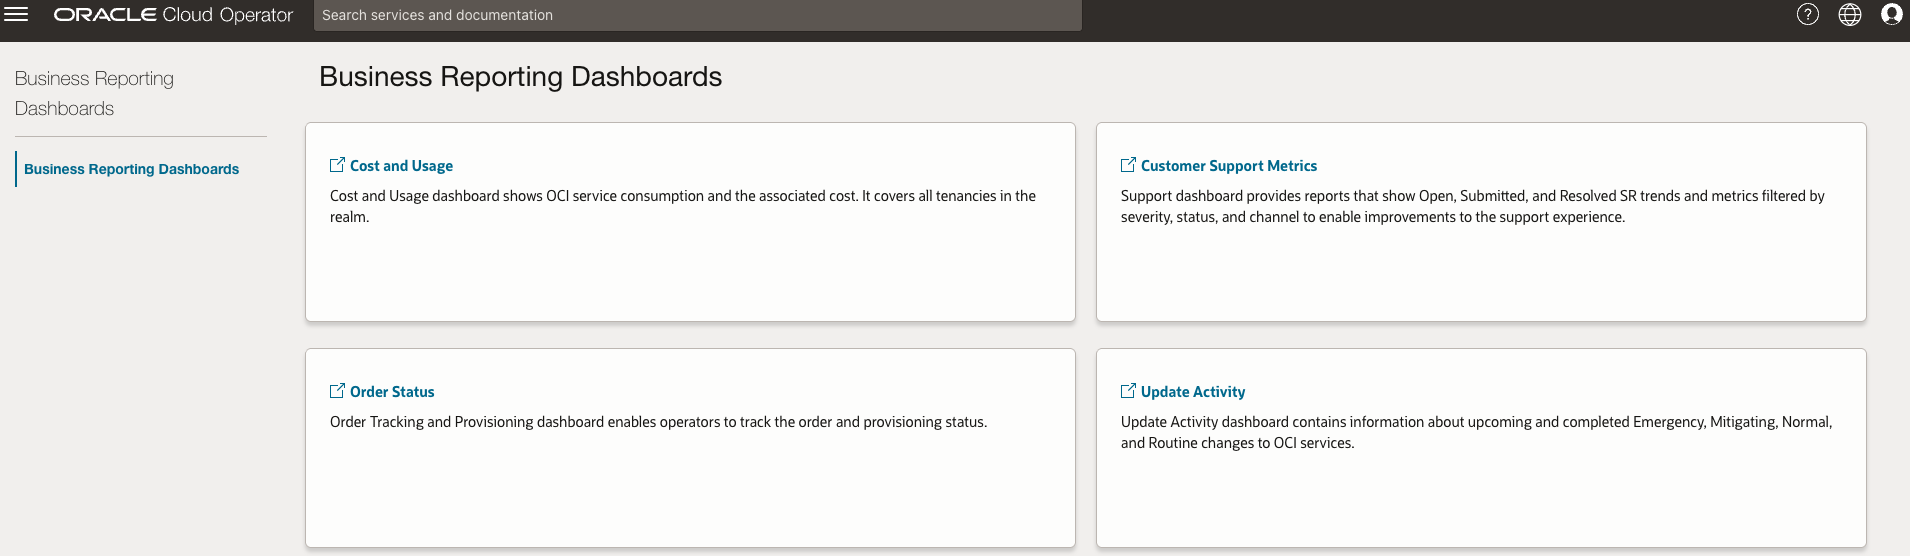
Dashboard Access and Common Controls
Access to dashboards and reports is role based. Depending on the assigned groups in the Operator Access Domain, users can be granted access to revenue and consumption reports, order and provisioning reports, capacity management views, and related reporting functions. Role-based access scopes dashboard visibility to pricing, subscription, billing, customer support, customer limits, or realm administration responsibilities.
Dashboards support the same common controls across the reporting experience. Alloy partners can refresh the displayed data, export the current view, and apply or clear filters from the filter bar. Refresh a dashboard before reviewing report data so that the latest available data is loaded. Export uses the filters that are applied when the export runs, which helps Alloy partners share a narrowed view instead of the full dashboard.
Cost and Usage Dashboard
The Cost and Usage dashboard provides usage and cost visibility across services, subscriptions, regions, and tenancies. Common filters include service, tenancy OCID, subscription OCID, region, and usage date.
The daily reporting view includes usage date, currency, cost, unit of measure, usage, product description, product SKU, service, region, tenancy OCID, and subscription OCID. This information helps Alloy partners trace consumption for executive review and operational follow-up.
Subscription OCID patterns help distinguish operator usage from end-customer usage in the reporting output. This dashboard is commonly used for consumption review, charge analysis, and decision support.
Order Status Dashboard
The Order Status dashboard tracks activation-related orders and provisioning progress. It provides visibility into orders and their current state, customer details, administrator email, activation-email status, and order-state definitions. Filter by order or creation period when Alloy partner need to review a specific onboarding path or monitor activation throughput.
The order lifecycle shown in the dashboard typically progresses through Creating, Pending Activation, Activating, and Active. Other states, such as Needs Attention, help identify activation or provisioning issues that require operator follow-up or Oracle intervention.
Customer Support Metrics Dashboard
The Customer Support Metrics dashboard reports on open, escalated, and resolved service requests. It includes views for open service requests, resolved service requests, and service request details so that Alloy partners can review backlog, trend lines, severity distribution, escalation status, and detailed request records from one reporting area.
This dashboard refreshes once per day. Use this dashboard for executive review, administrative review, backlog trending, and support-process improvement.
Update Activity Dashboard
The Update Activity dashboard provides visibility into scheduled and completed OCI service changes, including emergency, mitigating, normal, and routine changes. Scheduled views summarize upcoming change volume and detail by disruptive-change status, service, change type, region, and scheduled update details.
Completed views summarize updates completed in the last 24 hours, 7 days, and 30 days, with detail records for completed changes. Use this dashboard to correlate support events with platform activity and review near-term and recent change execution in the Oracle Alloy environment.
Data Freshness, Exports, and Direct Warehouse Access
Data freshness depends on the reporting dataset. Customer Support Metrics refreshes once per day. Operators must manually refresh dashboards before viewing them to load the latest available data. Order Status data can also be refreshed from the dashboard when Alloy partners need to check for newly processed orders.
When built-in dashboards are not sufficient, connect a business intelligence tool directly to the reporting data warehouse. Direct access requires a one-time setup to allowlist the client IP addresses, download the database wallet, and retrieve the current read-only credentials.
Oracle updates the data warehouse every 24 hours. The data warehouse exposes read-only views for cost and usage, customer support metrics, order status, update activity, and related reporting data so that Alloy partners can build custom dashboards and reports.