Environment Availability Metric
The environment availability metric provides near real-time status and 30 days historical reporting of operational status and availability of your Fusion Applications environments.
Use the environment availability metric to verify the near real-time status of services and to quickly identify any unexpected issues. This metric is displayed on the environment details page for all production, test, and development environments.
Understanding Environment Availability
You can view availability for the current day, the previous day, or the last 30 days. You can display the data as either a chart or a table.
The following table describes the availability status values:
| Event | Availability Chart Color | Health Status | Lifecycle State | Banner Displayed? | Recommended Action |
|---|---|---|---|---|---|
| Available | Green | Available | Active/Updating | n/a | n/a |
| Refresh | Orange | Refresh in progress | Updating | Yes | Check Refresh (under Resources) for the estimated end date or Work requests for the percent completion. |
| Standalone data masking | Orange | Unavailable | Updating | No | Check Security/Data masking (under Resources) for the estimated end date or Work requests for the percent completion. |
| Quarterly update/ monthly patching | Orange | Maintenance in progress | Updating | No | Check Maintenance (under Resources) for the estimated end date. |
| Enable/disable keys | Orange | Unavailable | Disabled | Yes | Check Security/Encryption (under Resources) for more details. |
| Disaster recovery switchover and switch back | Orange | Unavailable | Updating | Yes | See Disaster Recovery. |
| Unplanned Outage | Red | Unavailable | Updating | No | Log a support request. |
The availability check is run twice every 5 minutes, allowing near real-time status (within the 5 minute error margin).
The chart only shows the most critical event color when there are multiple events on a given day. Unplanned downtime is considered the most critical, then planned maintenance, and finally available status. For example, if there was an outage and maintenance on the same day, then that day's view shows as red to represent the unplanned downtime. You can mouse over the chart data to display the details of all planned and unplanned downtime. The popup shows the start and end times and total duration of all events for the given time frame. You can also display the data in a table view to see these details.
For maintenance downtimes, there can be a slight mismatch between the real-time metrics and the maintenance end time, because the real-time metrics include additional workflow steps performed to ensure the health of the application. For unplanned downtimes, the times shown in the chart should not be used to derive SLA calculations.
Viewing Environment Availability
To view the availability charts:
On the Environments list page, select the environment that you want to work with. If you need help finding the list page, see To list environments.
- On the environment details page, select Metrics.
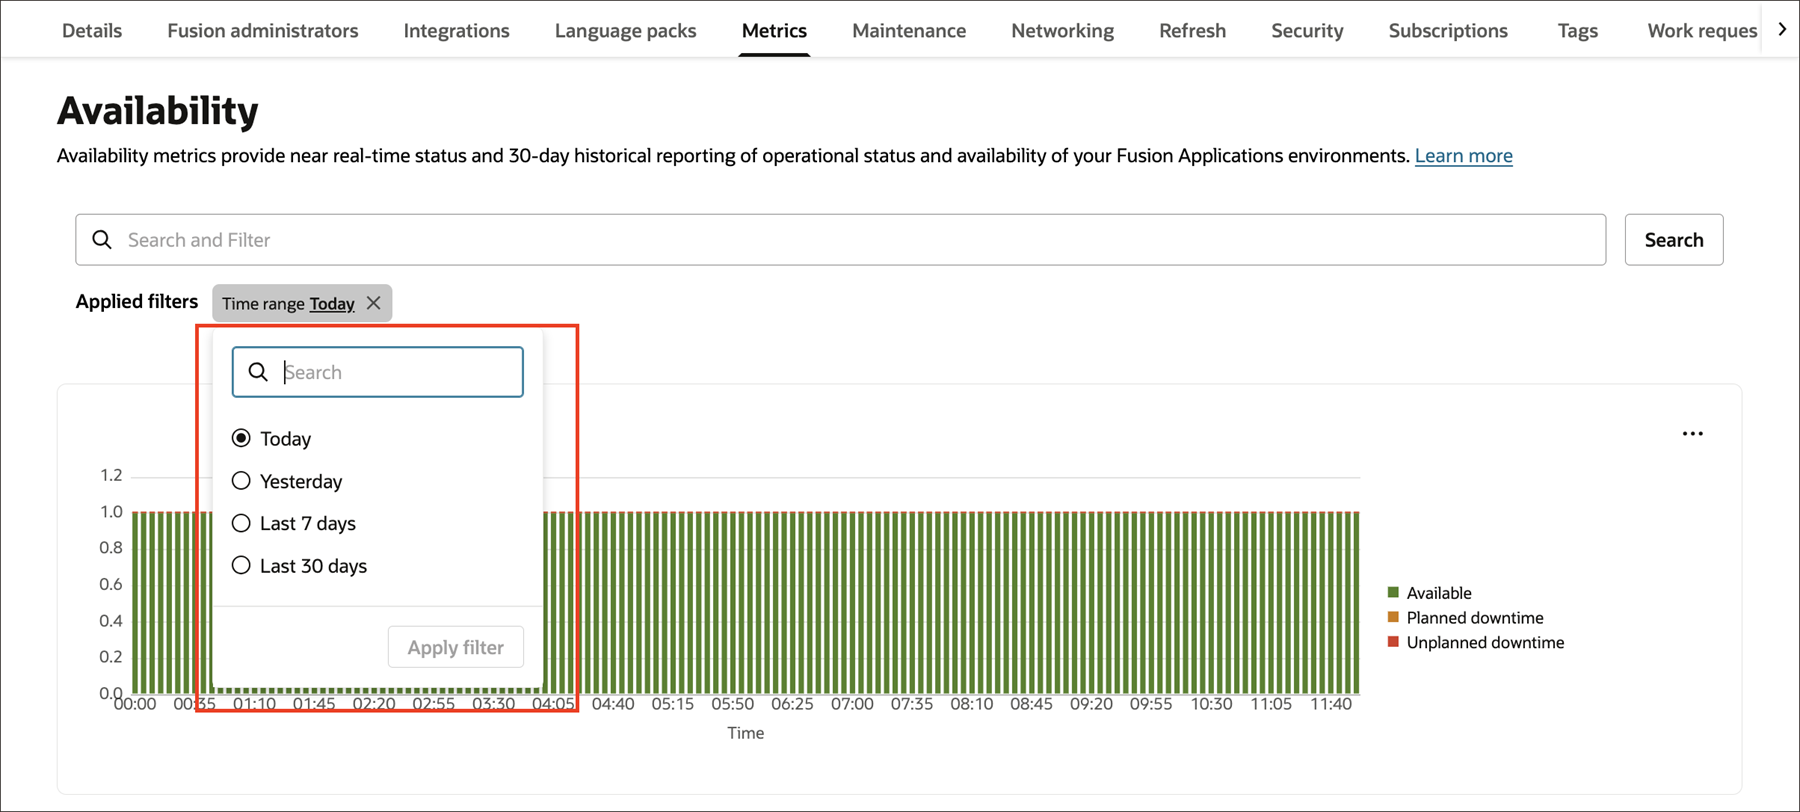
- Under Availability, filter the reporting data by time range. For example, you can view environment availability for the past week or the past 30 days.
To see the details, mouse over a time entry on the chart.
Use the to display the data as a table.