Reference for Data Science
This guide lists the predefined objects in OCI Resource Analytics for the Data Science service. You can find information about views, entity relationships, subject areas and sample queries.
Views
This section provides information about views within OCI Resource Analytics Data Science and their columns, data types, keys, and the referred view and column names. The following views are available:
| Name | Description |
|---|---|
| DATA_SCIENCE_JOB_DIM_V | This view stores information about job for training models. |
| DATA_SCIENCE_JOB_RUN_DIM_V | This view stores information about a job run. |
| DATA_SCIENCE_ML_APPLICATION_DIM_V | This view stores information about a definition of an AI/ML use case. |
| DATA_SCIENCE_ML_APPLICATION_IMPLEMENTATION_DIM_V | This view stores information about a resource representing a solution for a AI/ML use case defined by a ML Application. |
| DATA_SCIENCE_ML_APPLICATION_IMPLEMENTATION_VERSION_DIM_V | This view stores information about read only fully managed snapshots of MlApplicationImplementation taken when MlApplicationImplementation was updated with a new ML Application package. |
| DATA_SCIENCE_ML_APPLICATION_INSTANCE_DIM_V | This view stores information about a resource representing an instance of ML Application. |
| DATA_SCIENCE_ML_APPLICATION_INSTANCE_VIEW_DIM_V | This view stores information about a representation of a ML Application Instance which providers use for instance observability. |
| DATA_SCIENCE_MODEL_DIM_V | This view stores information about models, which are mathematical representations of the relationships between data. Models are represented by their associated metadata and artifacts. |
| DATA_SCIENCE_MODEL_DEPLOYMENT_DIM_V | This view stores information about model deployments, which are used by data scientists to perform predictions from the model hosted on an HTTP server. |
| DATA_SCIENCE_MODEL_VERSION_SET_DIM_V | This view stores information about a model version set to associate different versions of machine learning models. |
| DATA_SCIENCE_NOTEBOOK_SESSION_DIM_V | This view stores information about notebook sessions, which are interactive coding environments for data scientists. |
| DATA_SCIENCE_PIPELINE_DIM_V | This view stores information about a pipeline to orchestrate and execute machine learning workflows. |
| DATA_SCIENCE_PIPELINE_RUN_DIM_V | This view stores information about descriptions of pipeline runs. |
| DATA_SCIENCE_PRIVATE_ENDPOINT_DIM_V | This view stores information about data science private endpoints. |
| DATA_SCIENCE_PROJECT_DIM_V | This view stores information about projects, which enable users to organize their data science work. |
| DATA_SCIENCE_SCHEDULE_DIM_V | This view stores information about a repeating action. Examples: Invoke a ML Pipeline Run once an hour, Call ML Job Run every night at midnight. |
| DATA_SCIENCE_JOB_RUN_FACT_V | Fact table for Data Science job runs. |
| DATA_SCIENCE_PIPELINE_RUN_FACT_V | Fact table for Data Science pipeline runs. |
The suffixes in the view names designate the view type:
- FACT_V: Fact
- DIM_V: Dimension
The contents of each view and their relationships are listed in the following file: Data Science views.
Each tab in the Excel spreadsheet contains the details of a view.
Relationship Diagram
This section provides diagrams that define the logical relationship of a fact table with different dimension tables.
These diagrams show the relationship of the Data Science fact view with different dimension views.
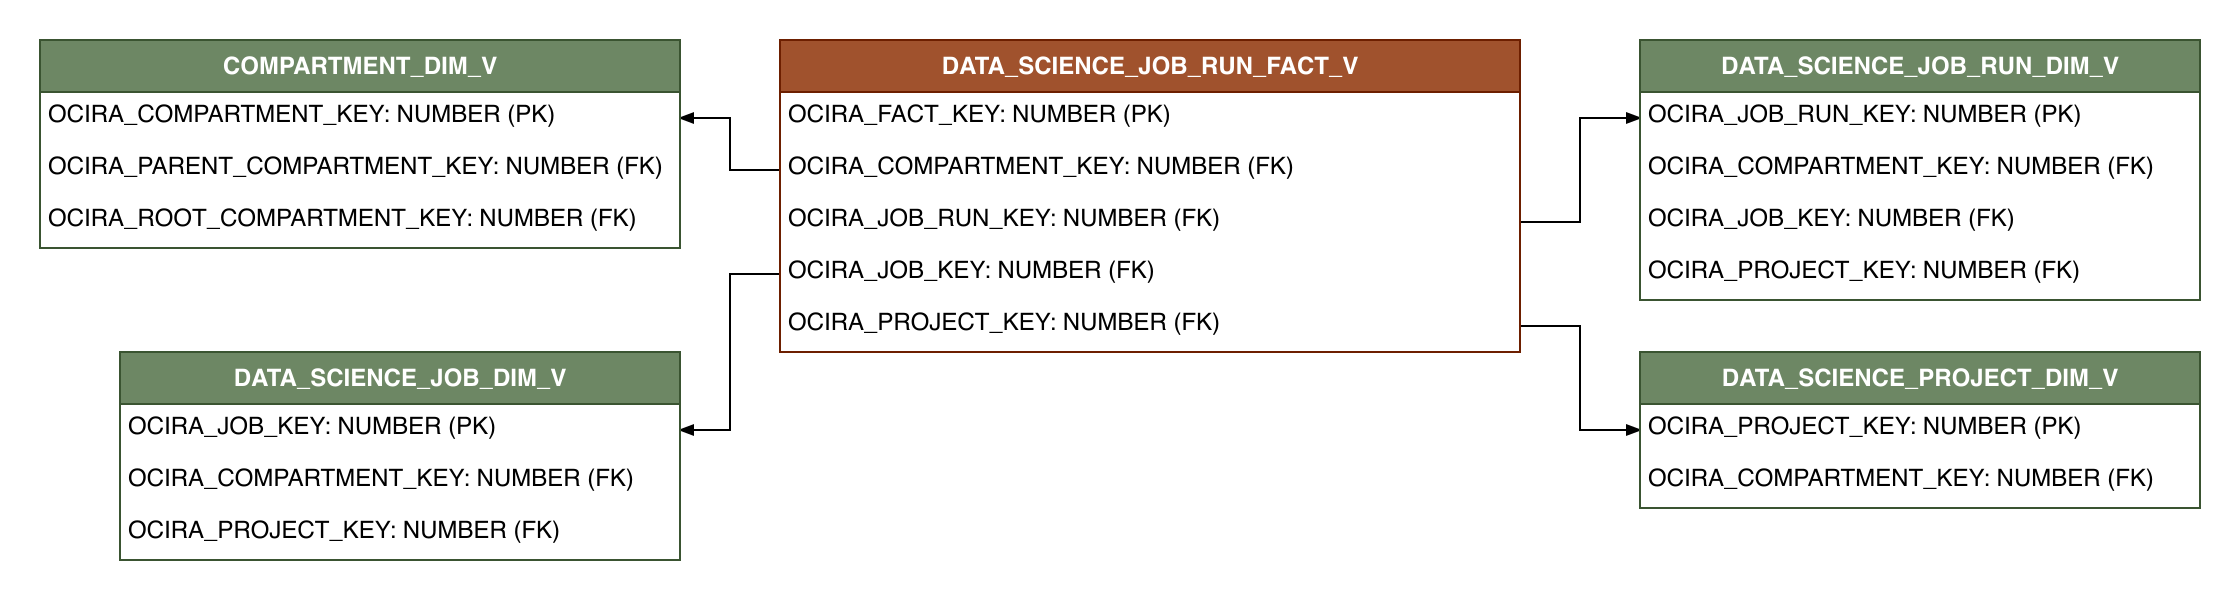
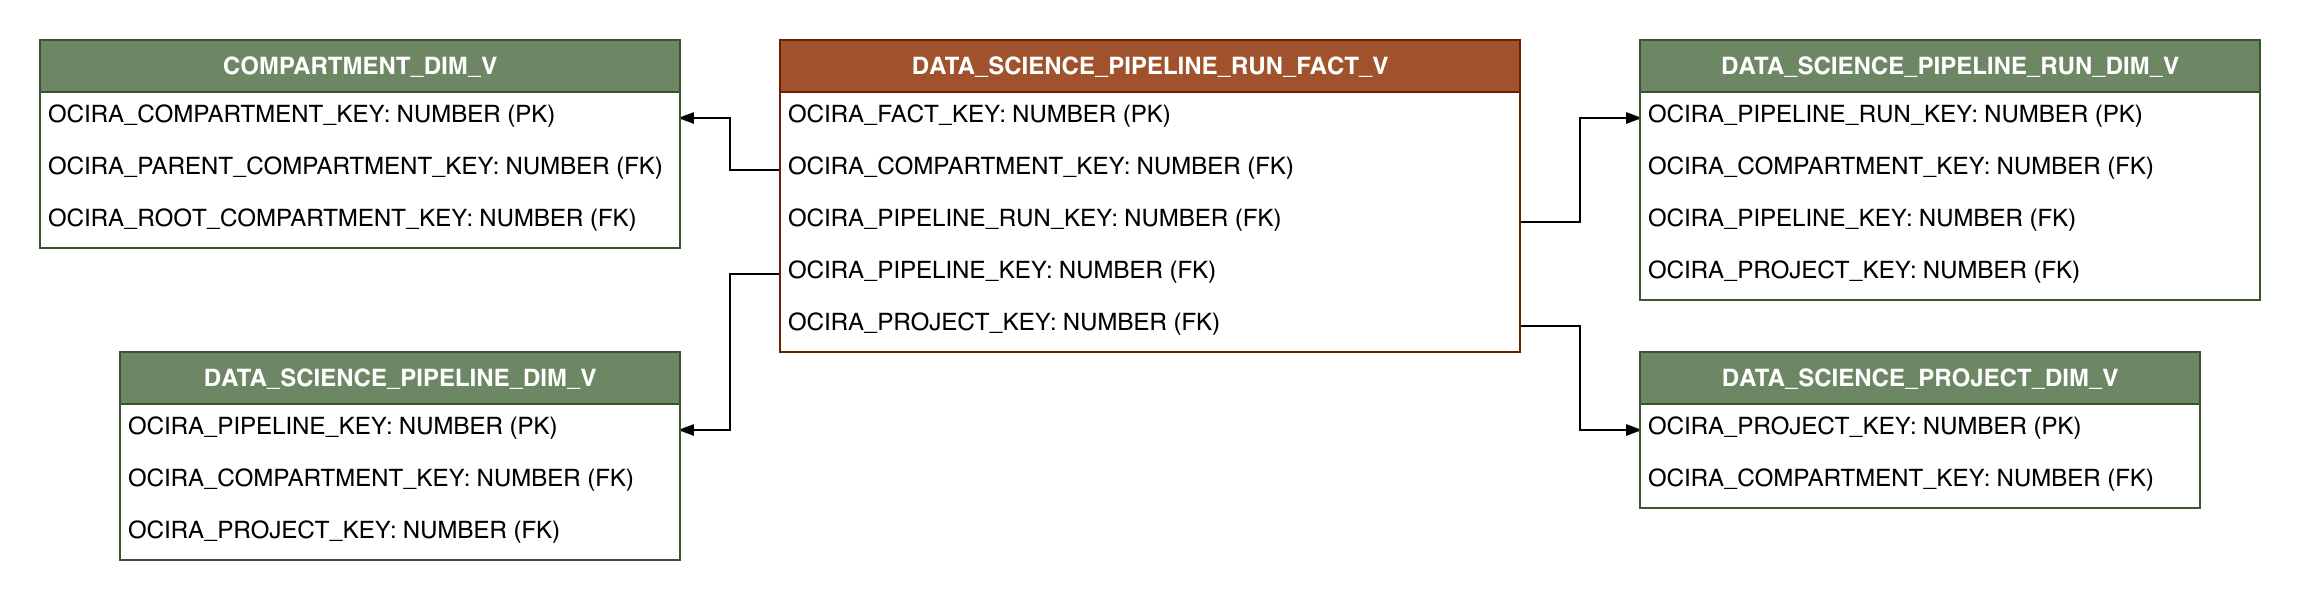
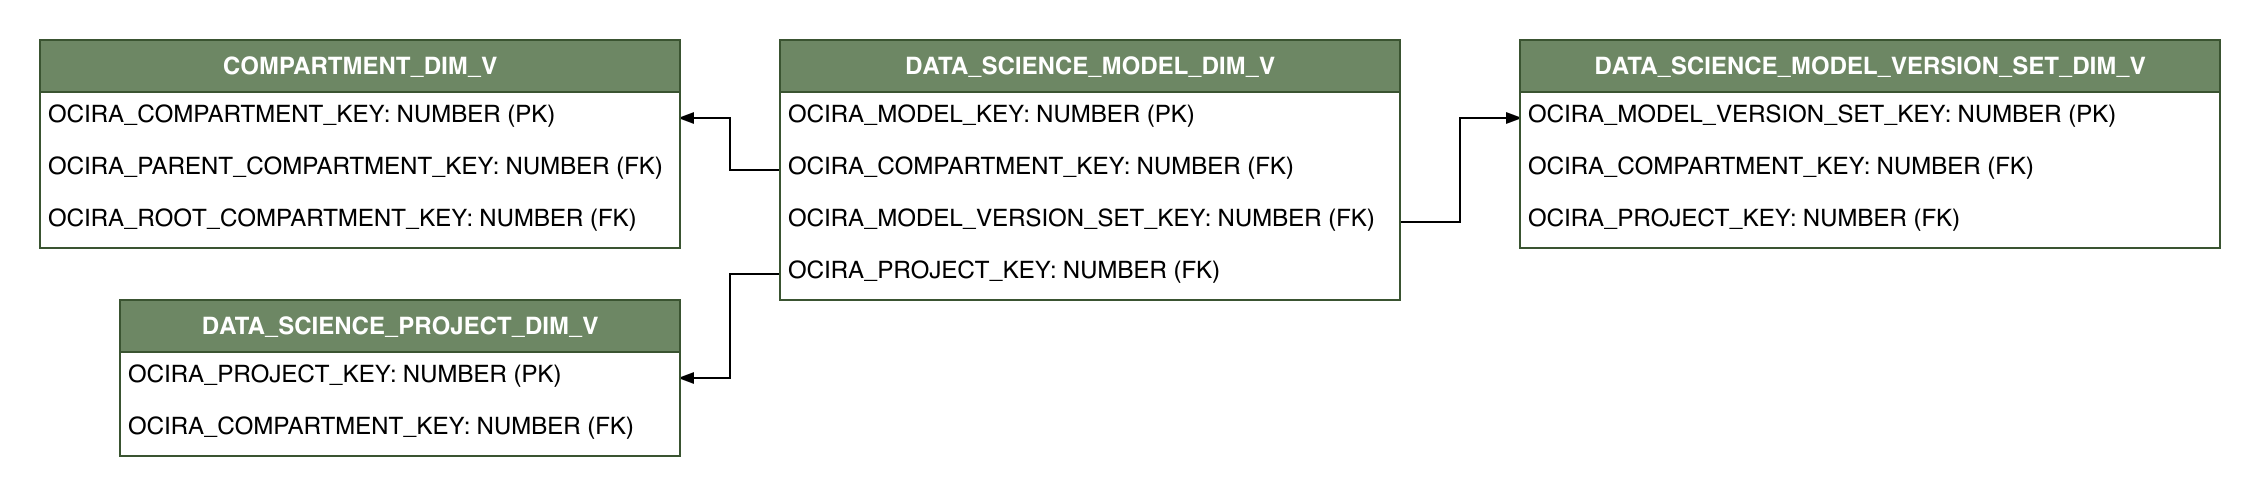
Relationships exist among dimensions. Dimensions can be joined directly to each other. These diagrams show the relationships between dimension views.



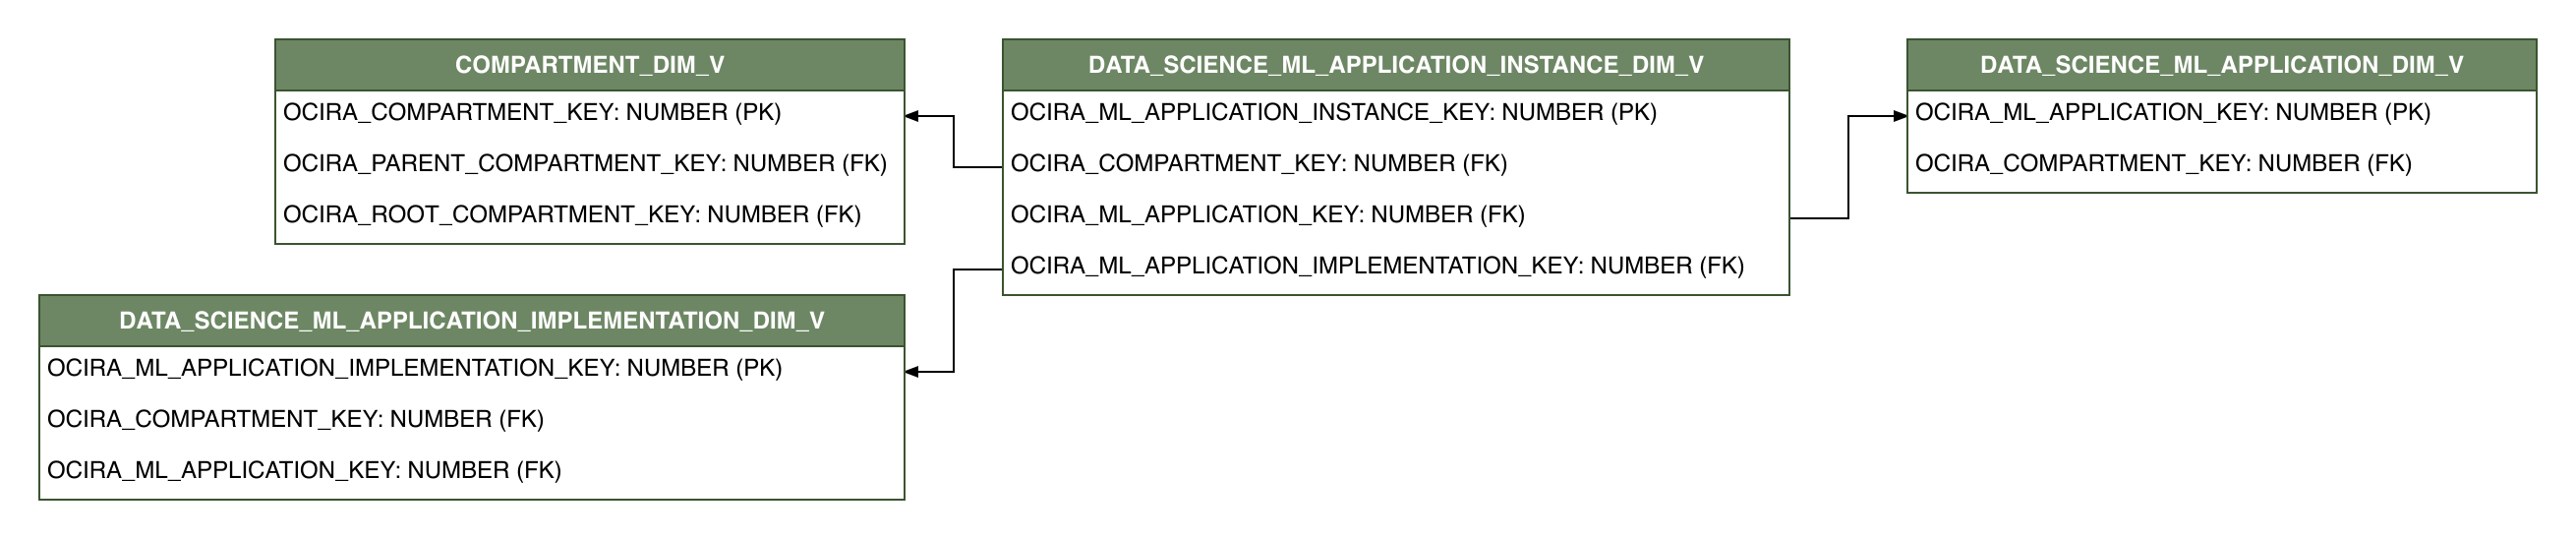
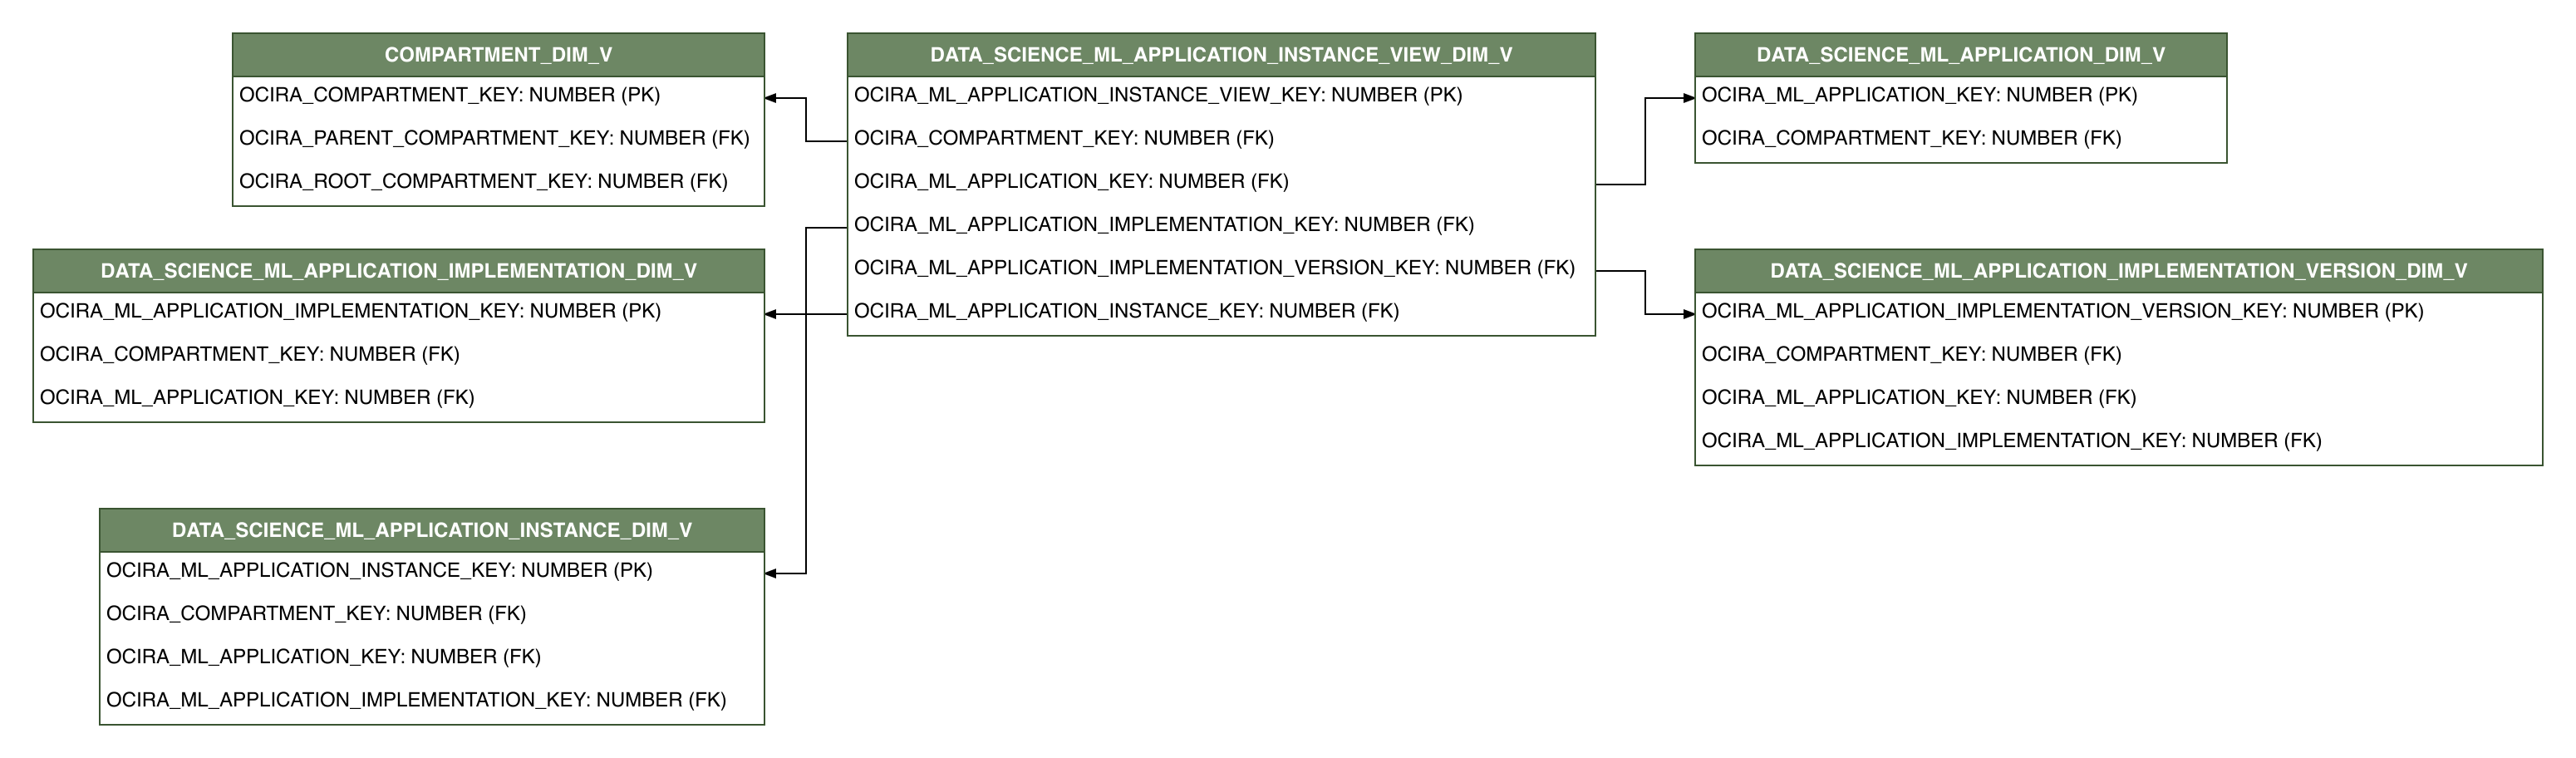





Sample Queries
Sample queries for Data Science.
List the number of job runs associated with each job ID.
SELECT
    JOB_ID,
    COUNT(JOB_RUN_ID) AS JOB_RUN_COUNT
FROM OCIRA.DATA_SCIENCE_JOB_RUN_FACT_V F
GROUP BY JOB_ID;
List the number of pipeline runs associated with each pipeline ID.
SELECT
    PIPELINE_ID,
    COUNT(PIPELINE_RUN_ID) AS PIPELINE_RUN_COUNT
FROM OCIRA.DATA_SCIENCE_PIPELINE_RUN_FACT_V F
GROUP BY PIPELINE_ID;
Data Lineage
The Customer Experience Semantic Model Lineage spreadsheet and Metric Calculation Logic spreadsheet for Data Science provide an end-to-end data lineage summary report for physical and logical relationships in your data.
For more information, see Data Lineage.
Subject Areas
This section provides information on the subject areas with data you maintain in Data Science. These subject areas, with their corresponding data, are available for you to use when creating and editing analyses and reports. The information for each subject area includes:
Description of the subject area.
Business questions that can be answered by data in the subject area, with a link to more detailed information about each business question.
Job-specific groups and duty roles that can be used to secure access to the subject area, with a link to more detailed information about each job role and duty role.
Primary navigation to the work area that's represented by the subject area.
Time reporting considerations in using the subject area, such as whether the subject area reports historical data or only the current data. Historical reporting refers to reporting on historical transactional data in a subject area. With a few exceptions, all dimensional data are current as of the primary transaction dates or system date.
The lowest grain of transactional data in a subject area. The lowest transactional data grain decides how data are joined in a report.
Special considerations, tips, and things to look out for in using the subject area to create analyses and reports.
Useful Resources
Oracle Cloud Infrastructure Documentation / API Reference
- Oracle Cloud Infrastructure Data Science Documentation
- DataSciencePrivateEndpoint Reference
- Job Reference
- JobRun Reference
- MlApplication Reference
- MlApplicationImplementation Reference
- MlApplicationImplementationVersion Reference
- MlApplicationInstance Reference
- MlApplicationInstanceView Reference
- Model Reference
- ModelDeployment Reference
- ModelVersionSet Reference
- NotebookSession Reference
- Pipeline Reference
- PipelineRun Reference
- Project Reference
- Schedule Reference