Using Search with OpenSearch Alerting and Notifications Plugins
Use OpenSearch's built-in alerting and notification plugins to monitor cluster health, performance metrics, and operational issues.
Correctly sizing and optimizing OpenSearch clusters is critical for performance and cost efficiency. Over time, cluster usage patterns can change, leading to overloading, increased latencies, or errors. Proactive monitoring and alerting are essential to detect and mitigate potential issues before they escalate.
OpenSearch has an inbuilt alerting and monitoring plugin that can help build such alerts. This topic provides guidance on setting up alerts, integrating with Oracle Notification service (ONS), and mitigating common issues.
OpenSearch Alerting Plugin
The alerting plugin provides monitoring and notification for events in OpenSearch. It uses REST APIs to create complex alerts based on cluster and node metrics. The alerting plugin contains the following features:
- Chained monitors: Combines multiple conditions from different REST API outputs to create complex alerts.
- Controlled intervals: Defines how often alerts are evaluated to avoid notification fatigue.
- RBAC support: Uses role-based access control for managing alerts.
For more information on OpenSearch monitoring, see Monitoring.
Supported Metrics and Alerts
You can configure the alerting plugin for the following metrics:
- Cluster Health: Status changes (Green, Yellow, Red).
- Node Metrics: High disk usage, CPU, JVM pressure.
- Shard Metrics: Large shards, excessive shard counts.
- Task Metrics: Stuck or rejected tasks, high scroll task counts.
- Throttling: Index or query throttling.
Setting Up Alerts
You can set up alerts on the outputs of the following OpenSearch APIs:
- _cluster/health
- _cluster/stats
- _cluster/settings
- _nodes/stats
- _cat/indices
- _cat/pending_tasks
- _cat/recovery
- _cat/shards
- _cat/snapshots
- _cat/tasks
For more information, see Per cluster metrics monitors.
OpenSearch Notification Plugin
Use the notification plugin to get automatic notifications about the alerts configured using the alerting plugin. Oracle Notification service (ONS) is integrated with the notification plugin. You can create channels using the notification plugin that send notifications to the ONS topic configured. You can then link these channels to alerts to receive notifications about firing alerts.
The following is an example of an alert notification:
Monitor Test index stats just entered alert status. Please investigate the issue.
- Trigger: test
- Severity: 2
- Period start: 2025-02-06-06T08:48:45.047Z
- Period end: 2025-02-06-06T08:49:45.047Z
For more information on the OpenSearch Notifications plugin, see Notifications.
Oracle Notification Service (ONS)
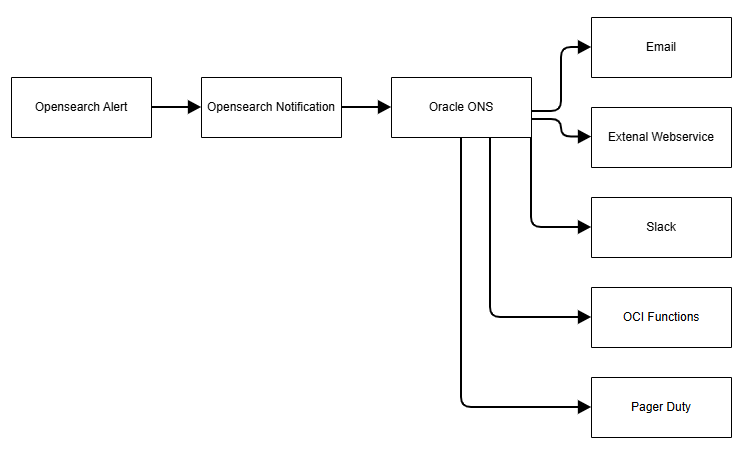
The Oracle Cloud Infrastructure Notifications service (ONS) broadcasts secure, highly reliable messages to distributed components through a publish-subscribe pattern. You can use it for applications hosted on Oracle Cloud Infrastructure and externally. Use ONS to get notified when event rules are triggered or alarms are breached, or to directly publish a message.
ONS supports the following channels for delivery of messages:
- Functions
- HTTP Endpoint (for external applications)
- PagerDuty
- Slack
- SMS
For more information on the OCI Notification service, see Notifications.
The following image shows how notifications are broadcast using ONS:
Sample Alerts with Notifications
You can create alerts to monitor most of the important areas of OpenSearch that can affect the performance of the OpenSearch cluster. Best practices is to setup warning level alerts that indicate some parameters becoming problematic, so that corrective action can be taken before the OpenSearch cluster goes into a bad state.
The following sections provide both warning and error level alerts that could be setup on your OpenSearch cluster.
Notification Channel
Before creating any alerts, we recommend you setup a notification channel. You can use your subscription to the ONS channel to get automatic notifications through various communication methods, including email, Slack, OCI functions, streams, and others.
The following example shows how to create a notification channel:
{

   "config_id": "sample-id",
   "name": "test-ons1",
   "config": {
      "name": "test-ons1",
      "description": "send notifications",
      "config_type": "ons",
       "is_enabled": true,
       "ons": {
         "topic_id": "ocid1.onstopic.oc1.iad.amaaaaaawtpq47yar24xitgso2wble2a5shal52r6zoc6eyth3jzsmbvxspa"
       }
   }
}
Cluster Health
Your OpenSearch cluster has following health states:
- Green: All shards available.
- Yellow: Some replica shards not available. Performance might suffer because of less replicas being available.
- Red: Some primary shards not available. Red indicates data unavailability, resulting in queries to unavailable shards failing.
Configuring Yellow Cluster Alerts
Use the following configuration to set up Yellow Alerts for your cluster:
POST: {{host}}/_plugins/_alerting/monitors/
{
  "type": "monitor",
  "schema_version": 0,
  "name": "ClusterHealthYellow",
  "monitor_type": "cluster_metrics_monitor",
  "enabled": true,
  "schedule": {
    "period": {
      "interval": 1,
      "unit": "MINUTES"
    }
  },
  "inputs": [
    {
      "uri": {
        "api_type": "CLUSTER_HEALTH",
        "path": "_cluster/health",
        "path_params": "",
        "url": "http://localhost:9200/_cluster/health",
        "clusters": []
      }
    }
  ],
  "triggers": [
    {
      "query_level_trigger": {
        "id": "xElVw5YBqFMdxmRChxIO",
        "name": "Check cluster health",
        "severity": "1",
        "condition": {
          "script": {
            "source": "ctx.results[0].status == \"yellow\"",
            "lang": "painless"
          }
        },
        "actions": [
          {
            "id": "notification585623",
            "name": "Notify test",
            "destination_id": "0WZDw5YBwxP9poIbQC8c",
            "message_template": {
              "source": "Monitor {{ctx.monitor.name}} just entered alert status. Please investigate the issue.\n  - Trigger: {{ctx.trigger.name}}\n  - Severity: {{ctx.trigger.severity}}\n  - Period start: {{ctx.periodStart}}\n  - Period end: {{ctx.periodEnd}}",
              "lang": "mustache"
            },
            "throttle_enabled": true,
            "subject_template": {
              "source": "Alerting Notification action",
              "lang": "mustache"
            },
            "throttle": {
              "value": 30,
              "unit": "MINUTES"
            }
          }
        ]
      }
    }
  ],
  "delete_query_index_in_every_run": false,
  "owner": "alerting"
}
Configuring Yellow Cluster Alerts
Use the following configuration to set up Red Alerts for your cluster:
POST {{host}}/_plugins/_alerting/monitors/
{
  "type": "monitor",
  "schema_version": 0,
  "name": "ClusterHealthRed",
  "monitor_type": "cluster_metrics_monitor",
  "enabled": true,
  "schedule": {
    "period": {
      "interval": 1,
      "unit": "MINUTES"
    }
  },
  "inputs": [
    {
      "uri": {
        "api_type": "CLUSTER_HEALTH",
        "path": "_cluster/health",
        "path_params": "",
        "url": "http://localhost:9200/_cluster/health",
        "clusters": []
      }
    }
  ],
  "triggers": [
    {
      "query_level_trigger": {
        "id": "xElVw5YBqFMdxmRChxIO",
        "name": "Check cluster health",
        "severity": "1",
        "condition": {
          "script": {
            "source": "ctx.results[0].status == \"red\"",
            "lang": "painless"
          }
        },
        "actions": [
          {
            "id": "notification585623",
            "name": "Notify test",
            "destination_id": "0WZDw5YBwxP9poIbQC8c",
            "message_template": {
              "source": "Monitor {{ctx.monitor.name}} just entered alert status. Please investigate the issue.\n  - Trigger: {{ctx.trigger.name}}\n  - Severity: {{ctx.trigger.severity}}\n  - Period start: {{ctx.periodStart}}\n  - Period end: {{ctx.periodEnd}}",
              "lang": "mustache"
            },
            "throttle_enabled": true,
            "subject_template": {
              "source": "Alerting Notification action",
              "lang": "mustache"
            },
            "throttle": {
              "value": 30,
              "unit": "MINUTES"
            }
          }
        ]
      }
    }
  ],
  "delete_query_index_in_every_run": false,
  "owner": "alerting"
}
Number of Nodes
Use the following configuration to specify the number of nodes for your cluster:
POST {{host}}/_plugins/_alerting/monitors/
{
  "type": "monitor",
  "schema_version": 0,
  "name": "ClusterNodesUnavailable",
  "monitor_type": "cluster_metrics_monitor",
  "enabled": true,
  "schedule": {
    "period": {
      "interval": 1,
      "unit": "MINUTES"
    }
  },
  "inputs": [
    {
      "uri": {
        "api_type": "CLUSTER_HEALTH",
        "path": "_cluster/health",
        "path_params": "",
        "url": "http://localhost:9200/_cluster/health",
        "clusters": []
      }
    }
  ],
  "triggers": [
    {
      "query_level_trigger": {
        "id": "xElVw5YBqFMdxmRChxIO",
        "name": "Check all nodes available",
        "severity": "1",
        "condition": {
          "script": {
            "source": "ctx.results[0].number_of_nodes< 8",
            "lang": "painless"
          }
        },
        "actions": [
          {
            "id": "notification585623",
            "name": "Notify test",
            "destination_id": "0WZDw5YBwxP9poIbQC8c",
            "message_template": {
              "source": "Monitor {{ctx.monitor.name}} just entered alert status. Please investigate the issue.\n  - Trigger: {{ctx.trigger.name}}\n  - Severity: {{ctx.trigger.severity}}\n  - Period start: {{ctx.periodStart}}\n  - Period end: {{ctx.periodEnd}}",
              "lang": "mustache"
            },
            "throttle_enabled": true,
            "subject_template": {
              "source": "Alerting Notification action",
              "lang": "mustache"
            },
            "throttle": {
              "value": 30,
              "unit": "MINUTES"
            }
          }
        ]
      }
    }
  ],
  "delete_query_index_in_every_run": false,
  "owner": "alerting"
}
Troubleshooting Issues
Cluster health can become Yellow or Red because of various reasons such as a failed restore, nodes temporarily getting disconnected, disk getting full. While some problems need to be fixed by the OCI OpenSearch team, you can troubleshoot and fix other problems yourself.
Follow these steps to address issues yourself:
- Get a list of all the shards using the Cat Shards API, to get an idea of the shards that are unassigned.
- If the OpenSearch cluster is Red:
- Check the allocation reason for the unallocated shards using the CAT allocation API.
- Use the force reroute API to try reallocation of shards, if the issue was temporary and is mitigated.
- If the shard allocation explanation mentions a failed restoration try, restore the cluster to a previous known good state.
- If issue still persists, contact the OCI OpenSearch team.
- If the OpenSearch cluster is Yellow:
- Check if the number of nodes is equal to or greater than the maximum replicas for an index.
- Check the allocation reason for the unallocated shards using the CAT allocation API
- If issue seems to be temporary, use the force reroute API to reallocate the shards.
If one or more nodes in the cluster aren't available for a prolonged period of time, contact the OCI OpenSearch team. These symptoms indicate something could be wrong with the underlying infrastructure.
Node Level Statistics
All OpenSearch nodes should have a good buffer in terms of all the basic metrics, such as CPU, RAM and disk space, for them to function optimally. Reaching critical levels of these metrics can lead to reduced latencies, increased lags, and eventually lead to nodes getting hung or leaving the cluster.
You can set two levels of alerts can be set on these metrics: One for a warning level and other for a critical level.
High Disk/CPU/JVM
Warning Level
Use the following configuration to specify a Warning Level alert for the OpenSearch nodes:
POST {{host}}/_plugins/_alerting/monitors/

{
  "type": "monitor",
  "name": "DiskUsage",
  "monitor_type": "cluster_metrics_monitor",
  "enabled": false,
  "enabled_time": null,
  "schedule": {
    "period": {
      "interval": 1,
      "unit": "MINUTES"
    }
  },
  "inputs": [
    {
      "uri": {
        "api_type": "NODES_STATS",
        "path": "_nodes/stats",
        "path_params": "",
        "url": "http://localhost:9200/_nodes/stats"
      }
    }
  ],
  "triggers": [
    {
      "query_level_trigger": {
        "name": "test",
        "severity": "2",
        "condition": {
          "script": {
            "source": "for (entry in ctx.results[0].nodes.entrySet())\n\n{\n\n    if ((entry.getValue().fs.total.total_in_bytes -entry.getValue().fs.total.free_in_bytes)*100/entry.getValue().fs.total.total_in_bytes > 70) {\n\n        return true;\n\n}\n\n}\n\nreturn false;",
            "lang": "painless"
          }
        },
        "actions": [
            {
              "id": "notification585623",
              "name": "Notify test",
              "destination_id": "0WZDw5YBwxP9poIbQC8c",
              "message_template": {
                "source": "Monitor {{ctx.monitor.name}} just entered alert status. Please investigate the issue.\n  - Trigger: {{ctx.trigger.name}}\n  - Severity: {{ctx.trigger.severity}}\n  - Period start: {{ctx.periodStart}}\n  - Period end: {{ctx.periodEnd}}",
                "lang": "mustache"
              },
              "throttle_enabled": true,
              "subject_template": {
                "source": "Alerting Notification action",
                "lang": "mustache"
              },
              "throttle": {
                "value": 30,
                "unit": "MINUTES"
              }
            }
        ]
      }
    }
  ]
}
Critical Level
Use the following configuration to specify a Critical Level alert for the OpenSearch nodes:
POST {{host}}/_plugins/_alerting/monitors/

{
  "type": "monitor",
  "name": "DiskUsage",
  "monitor_type": "cluster_metrics_monitor",
  "enabled": false,
  "enabled_time": null,
  "schedule": {
    "period": {
      "interval": 1,
      "unit": "MINUTES"
    }
  },
  "inputs": [
    {
      "uri": {
        "api_type": "NODES_STATS",
        "path": "_nodes/stats",
        "path_params": "",
        "url": "http://localhost:9200/_nodes/stats"
      }
    }
  ],
  "triggers": [
    {
      "query_level_trigger": {
        "name": "test",
        "severity": "2",
        "condition": {
          "script": {
            "source": "for (entry in ctx.results[0].nodes.entrySet())\n\n{\n\n    if ((entry.getValue().fs.total.total_in_bytes -entry.getValue().fs.total.free_in_bytes)*100/entry.getValue().fs.total.total_in_bytes > 85) {\n\n        return true;\n\n}\n\n}\n\nreturn false;",
            "lang": "painless"
          }
        },
        "actions": [
            {
              "id": "notification585623",
              "name": "Notify test",
              "destination_id": "0WZDw5YBwxP9poIbQC8c",
              "message_template": {
                "source": "Monitor {{ctx.monitor.name}} just entered alert status. Please investigate the issue.\n  - Trigger: {{ctx.trigger.name}}\n  - Severity: {{ctx.trigger.severity}}\n  - Period start: {{ctx.periodStart}}\n  - Period end: {{ctx.periodEnd}}",
                "lang": "mustache"
              },
              "throttle_enabled": true,
              "subject_template": {
                "source": "Alerting Notification action",
                "lang": "mustache"
              },
              "throttle": {
                "value": 30,
                "unit": "MINUTES"
              }
            }
        ]
      }
    }
  ]
}
Troubleshooting
For high disk usage, try increasing disk size, or setting up ISM policies to purge old data.
Review your traffic and node configurations, if the cluster is under stress because of node parameters for a long time, it typically indicates an underconfigured cluster.
Pending Tasks
The list of pending tasks specifies which OpenSearch tasks are being performed on which nodes. Most of the OpenSearch tasks, other than a few like reindexing operation, are small tasks that OpenSearch divided from larger efforts.
Use the following configuration to list the pending tasks for the OpenSearch nodes:
POST {{host}}/_plugins/_alerting/monitors/
{
    "type": "monitor",
    "schema_version": 0,
    "name": "pending_tasks",
    "monitor_type": "cluster_metrics_monitor",
    "enabled": true,
    "enabled_time": 1746584774661,
    "schedule": {
      "period": {
        "interval": 1,
        "unit": "MINUTES"
      }
    },
    "inputs": [
      {
        "uri": {
          "api_type": "CAT_TASKS",
          "path": "_cat/tasks",
          "path_params": "",
          "url": "http://localhost:9200/_cat/tasks",
          "clusters": []
        }
      }
    ],
    "triggers": [
      {
        "query_level_trigger": {
          "id": "jUOQqJYBQxJTy-1pqNIF",
          "name": "test",
          "severity": "1",
          "condition": {
            "script": {
              "source": "for (item in ctx.results[0].tasks){\n\nif(item.running_time_in_nanos> 300000000000) return true;\n}\nreturn false\n",
              "lang": "painless"
            }
          },
          "actions": [{
            "id": "notification585623",
            "name": "Notify test",
            "destination_id": "0WZDw5YBwxP9poIbQC8c",
            "message_template": {
              "source": "Monitor {{ctx.monitor.name}} just entered alert status. Please investigate the issue.\n  - Trigger: {{ctx.trigger.name}}\n  - Severity: {{ctx.trigger.severity}}\n  - Period start: {{ctx.periodStart}}\n  - Period end: {{ctx.periodEnd}}",
              "lang": "mustache"
            },
            "throttle_enabled": true,
            "subject_template": {
              "source": "Alerting Notification action",
              "lang": "mustache"
            },
            "throttle": {
              "value": 30,
              "unit": "MINUTES"
            }
          }]
        }
      }
    ],
    "delete_query_index_in_every_run": false
}
Troubleshooting
Pending tasks can indicate an overload on the node, an incorrect state of the node, or an incorrect parameters for the task. Use the following guidance to troubleshoot issues related to pending nodes:
- If your cluster is running multiple type merges or bulk indexes, perform a force merge to resolve the issue as it merges everything in one action.
- If your cluster experiences type cluster update settings getting stuck, it could indicate an issue with state of the node or the node's queues. Try deleting stuck tasks or restarting the node to fix the issue.
- If your cluster experiences type snapshots getting stuck, it could indicate an issue with the repository. Check the repository settings. Contact the OCI OpenSearch team if the error is related to automated backups.
Rejected Tasks and Threads
Rejected threads indicate a high level of throttling amongst tasks. For example, it could be when there is so much activity, many index and search requests that can't get served get throttled instead.
Use the following configuration to list the rejected tasks and threads:
POST {{host}}/_plugins/_alerting/monitors/
{
  "type": "monitor",
  "schema_version": 0,
  "name": "Rejected threads",
  "monitor_type": "cluster_metrics_monitor",
  "enabled": true,
  "schedule": {
    "period": {
      "interval": 1,
      "unit": "MINUTES"
    }
  },
  "inputs": [
    {
      "uri": {
        "api_type": "NODES_STATS",
        "path": "_nodes/stats",
        "path_params": "",
        "url": "http://localhost:9200/_nodes/stats",
        "clusters": []
      }
    }
  ],
  "triggers": [
    {
      "query_level_trigger": {
        "id": "1kNRrpYBQxJTy-1pGtJ9",
        "name": "rejected thread pool",
        "severity": "1",
        "condition": {
          "script": {
            "source": "for (entry in ctx.results[0].nodes.entrySet())\n{\n    for (e in entry.getValue().thread_pool.entrySet()) {\n        if(e.getValue().rejected>10){\n        return true;\n}\n\n}\n\n}\n\nreturn false;",
            "lang": "painless"
          }
        },
        "actions": [{
          "id": "notification585623",
          "name": "Notify test",
          "destination_id": "0WZDw5YBwxP9poIbQC8c",
          "message_template": {
            "source": "Monitor {{ctx.monitor.name}} just entered alert status. Please investigate the issue.\n  - Trigger: {{ctx.trigger.name}}\n  - Severity: {{ctx.trigger.severity}}\n  - Period start: {{ctx.periodStart}}\n  - Period end: {{ctx.periodEnd}}",
            "lang": "mustache"
          },
          "throttle_enabled": true,
          "subject_template": {
            "source": "Alerting Notification action",
            "lang": "mustache"
          },
          "throttle": {
            "value": 30,
            "unit": "MINUTES"
          }
        }]
      }
    }
  ],
  "delete_query_index_in_every_run": false,
  "owner": "alerting"
}
Troubleshooting
Rejected tasks can indicate an overload on the system. Review at the type of tasks rejected. Check if the traffic of these tasks can be reduced, or the settings/structure of the task changed.
If the Search function is being throttled, check if the search query can be optimized.
If the Indexing function is being throttled, check if you can update the rate of indexing or bulk settings, or if you can break the index and shards into smaller tasks.
Index Level Statistics
Shard Sizing
Index data is stored in independent structures, known as shards. Every shard is made up of segments, which are loaded into the OpenSearch memory to aid the Search function. Shards in the 30-50 GB range or larger lead to bigger segments, that lead to increased memory usage. Correctly sizing shards is important to cluster performance. Shard sizes can typically be controlled by Index Lifecycle Management (ILM) policies. For indexes that don't have ILM, you can set up alerts on shard sizes to avoid indexes from becoming too large.
Use the following configuration to list the shards and their sizes:
POST {{host}}/_plugins/_alerting/monitors/
{
  "type": "monitor",
  "schema_version": 0,
  "name": "Big shard size",
  "monitor_type": "cluster_metrics_monitor",
  "enabled": true,
  "schedule": {
    "period": {
      "interval": 1,
      "unit": "MINUTES"
    }
  },
  "inputs": [
    {
      "uri": {
        "api_type": "CAT_SHARDS",
        "path": "_cat/shards",
        "path_params": "",
        "url": "http://localhost:9200/_cat/shards",
        "clusters": []
      }
    }
  ],
  "triggers": [
    {
      "query_level_trigger": {
        "id": "pkOWqJYBQxJTy-1pO9Im",
        "name": "big shards",
        "severity": "1",
        "condition": {
          "script": {
            "source": "for (item in ctx.results[0].shards)\nif((item.store != null)&&(item.store.contains(\"gb\"))&&(item.store.length()>4)\n&&(Double.parseDouble(item.store.substring(0,item.store.length()-3))>30)) return true\n",
            "lang": "painless"
          }
        },
        "actions": [
          {
            "id": "notification585623",
            "name": "Notify test",
            "destination_id": "0WZDw5YBwxP9poIbQC8c",
            "message_template": {
              "source": "Monitor {{ctx.monitor.name}} just entered alert status. Please investigate the issue.\n  - Trigger: {{ctx.trigger.name}}\n  - Severity: {{ctx.trigger.severity}}\n  - Period start: {{ctx.periodStart}}\n  - Period end: {{ctx.periodEnd}}",
              "lang": "mustache"
            },
            "throttle_enabled": true,
            "subject_template": {
              "source": "Alerting Notification action",
              "lang": "mustache"
            },
            "throttle": {
              "value": 30,
              "unit": "MINUTES"
            }
          }
        ]
      }
    }
  ],
  "delete_query_index_in_every_run": false
}
Troubleshooting
Set up your cluster's ILM policy to roll over indexes when they reach a certain size.
Increase the number of shards for existing indexes that have grown using the reindexing feature. For large indices over 100 GB, following these best practices:
- Divide the task down into smaller parts using the query API.
- Set the appropriate batch size and number of requests per second.
Lagging Indexing
When data is indexed into the cluster, OpenSearch initially writes it into a translog file. The OpenSearch process then picks up entries from this file at regular intervals to ingest the data into its Apache Lucene structures, creating appropriate segments with required internal objects such as tokenizers, field data, and so forth. High rates of ingestion or an underconfigured cluster can lead to the ingestion process lagging. Here, the translog file size grows along with the lag in indexing of documents. You can monitor this behavior using the indexing statistics.
Use the following configuration to monitor index lagging:
POST {{host}}/_plugins/_alerting/monitors/
{
  "type": "monitor",
  "schema_version": 0,
  "name": "UncommittedSize large",
  "monitor_type": "cluster_metrics_monitor",
  "enabled": true,
  "schedule": {
    "period": {
      "interval": 1,
      "unit": "MINUTES"
    }
  },
  "inputs": [
    {
      "uri": {
        "api_type": "NODES_STATS",
        "path": "_nodes/stats",
        "path_params": "",
        "url": "http://localhost:9200/_nodes/stats",
        "clusters": []
      }
    }
  ],
  "triggers": [
    {
      "query_level_trigger": {
        "id": "4Ulmw5YBqFMdxmRCWBL3",
        "name": "Uncommited size",
        "severity": "1",
        "condition": {
          "script": {
            "source": "for (entry in ctx.results[0].nodes.entrySet())\n{    if (entry.getValue().indices.translog.uncommitted_size_in_bytes>1000000000) {       \n      return true;\n     }\n}\nreturn false;",
            "lang": "painless"
          }
        },
        "actions": [
          {
            "id": "notification585623",
            "name": "Notify test",
            "destination_id": "0WZDw5YBwxP9poIbQC8c",
            "message_template": {
              "source": "Monitor {{ctx.monitor.name}} just entered alert status. Please investigate the issue.\n  - Trigger: {{ctx.trigger.name}}\n  - Severity: {{ctx.trigger.severity}}\n  - Period start: {{ctx.periodStart}}\n  - Period end: {{ctx.periodEnd}}",
              "lang": "mustache"
            },
            "throttle_enabled": true,
            "subject_template": {
              "source": "Alerting Notification action",
              "lang": "mustache"
            },
            "throttle": {
              "value": 30,
              "unit": "MINUTES"
            }
          }
        ]
      }
    }
  ],
  "delete_query_index_in_every_run": false,
  "owner": "alerting"
}
Troubleshooting
When troubleshooting lagging indexing, perform the following tasks:
- Review indexing pressure.
- Review the other node statistics such as CPU, memory, disk IO stats.
Consider following options based on the results of the preceding tasks:
- Reduce indexing pressure.
- Increase the configuration of the nodes.
- Increase the refresh_interval, if the translog isn't too high.
Throttling
OpenSearch stores data in the form of Lucene segments. The segments are condensed and merged together continuously to collate many operations on the same documents. When the required indexing speed is greater than what the OpenSearch cluster can accommodate, these merges get throttled. You can monitor throttling using indexing statistics, and update the throttling threshold to meet your requirements.
Use the following configuration to set up throttling:
POST {{host}}/_plugins/_alerting/monitors/
{
  "type": "monitor",
  "schema_version": 0,
  "name": "Merge Throttling",
  "monitor_type": "cluster_metrics_monitor",
  "enabled": true,
  "schedule": {
    "period": {
      "interval": 1,
      "unit": "MINUTES"
    }
  },
  "inputs": [
    {
      "uri": {
        "api_type": "NODES_STATS",
        "path": "_nodes/stats",
        "path_params": "",
        "url": "http://localhost:9200/_nodes/stats",
        "clusters": []
      }
    }
  ],
  "triggers": [
    {
      "query_level_trigger": {
        "name": "Merge Throttling",
        "severity": "1",
        "condition": {
          "script": {
            "source": "for (entry in ctx.results[0].nodes.entrySet())\n{    if (entry.getValue().indices.merges.total_throttled_time_in_millis>300000) {       \n      return true;\n     }\n}\nreturn false;",
            "lang": "painless"
          }
        },
        "actions": [
          {
            "id": "notification585623",
            "name": "Notify test",
            "destination_id": "0WZDw5YBwxP9poIbQC8c",
            "message_template": {
              "source": "Monitor {{ctx.monitor.name}} just entered alert status. Please investigate the issue.\n  - Trigger: {{ctx.trigger.name}}\n  - Severity: {{ctx.trigger.severity}}\n  - Period start: {{ctx.periodStart}}\n  - Period end: {{ctx.periodEnd}}",
              "lang": "mustache"
            },
            "throttle_enabled": true,
            "subject_template": {
              "source": "Alerting Notification action",
              "lang": "mustache"
            },
            "throttle": {
              "value": 30,
              "unit": "MINUTES"
            }
          }
        ]
      }
    }
  ],
  "delete_query_index_in_every_run": false,
  "owner": "alerting"
}
Troubleshooting
When troubleshooting throttling, perform the following tasks:
- Review indexing pressure.
- Review the other node statistics such as CPU, memory, disk IO stats.
Consider following options based on the results of the preceding tasks:
- Reduce indexing pressure.
- Increase the configuration of the nodes.
- Increase the refresh_interval, if the translog isn't too high.
Search
Scrolls
Search with scroll is used when many results are expected. However, using too many scrolls takes up memory in OpenSearch because it must maintain the context, leading to poor performance. The f alert can be used to keep a tab on number of scrolls consistently open.
Use the following configuration to track the number of scrolls consistently open.
POST {{host}}/_plugins/_alerting/monitors/
{
  "type": "monitor",
  "schema_version": 0,
  "name": "Large Number of Open Scrolls",
  "monitor_type": "cluster_metrics_monitor",
  "enabled": true,
  "schedule": {
    "period": {
      "interval": 1,
      "unit": "MINUTES"
    }
  },
  "inputs": [
    {
      "uri": {
        "api_type": "NODES_STATS",
        "path": "_nodes/stats",
        "path_params": "",
        "url": "http://localhost:9200/_nodes/stats",
        "clusters": []
      }
    }
  ],
  "triggers": [
    {
      "query_level_trigger": {
        "id": "4Ulmw5YBqFMdxmRCWBL3",
        "name": "Open Scrolls",
        "severity": "1",
        "condition": {
          "script": {
            "source": "for (entry in ctx.results[0].nodes.entrySet())\n{    if (entry.getValue().indices.search.scroll_current>200) {       \n      return true;\n     }\n}\nreturn false;",
            "lang": "painless"
          }
        },
        "actions": [
          {
            "id": "notification585623",
            "name": "Notify test",
            "destination_id": "0WZDw5YBwxP9poIbQC8c",
            "message_template": {
              "source": "Monitor {{ctx.monitor.name}} just entered alert status. Please investigate the issue.\n  - Trigger: {{ctx.trigger.name}}\n  - Severity: {{ctx.trigger.severity}}\n  - Period start: {{ctx.periodStart}}\n  - Period end: {{ctx.periodEnd}}",
              "lang": "mustache"
            },
            "throttle_enabled": true,
            "subject_template": {
              "source": "Alerting Notification action",
              "lang": "mustache"
            },
            "throttle": {
              "value": 30,
              "unit": "MINUTES"
            }
          }
        ]
      }
    }
  ],
  "delete_query_index_in_every_run": false,
  "owner": "alerting"
}