Using Apache Ambari
Apache Ambari provides a web user interface to manage and monitor the Hadoop components on your cluster. Apache Ambari runs on the utility node of a cluster (or on the first utility node of a secure, highly-available (HA) cluster).
Before You Begin
Before you can access Apache Ambari from a browser, an administrator must:
-
Make the node available to incoming connections from users. The node's private IP address can be mapped to a public IP address, which permits access from the public internet. Alternatively, the cluster can be set up to use a bastion host or Oracle FastConnect. See Connecting to Cluster Nodes with Private IP Addresses.
- Open port
7183on the node by configuring the ingress rules in the network security list. See Defining Security Rules.
Managing Cluster Roles in Ambari
Manage cluster roles in Ambari for use with Big Data Service clusters and components.
Ambari administrators can manage user access and permissions at various levels within the system. They can assign roles to users, granting them specific access rights to Ambari-, Clusters-, Hosts-, Services-, or User-(view-only) level permissions. This role-based access control mechanism allows for a distributed management approach, where responsibilities are delegated while still maintaining overall control over the Ambari management facility.
For information on managing Ambari users and roles, see Managing Ambari Cluster Roles.
Using the Apache Ambari Dashboard
Use the Apache Ambari dashboard to monitor the health and status of your Big Data Service cluster that uses Oracle Distribution including Apache Hadoop.
When you Access Apache Ambari, the dashboard is displayed. There are three main toolbars: the top horizontal toolbar, the tabs and dropdown menus, and the vertical side toolbar.
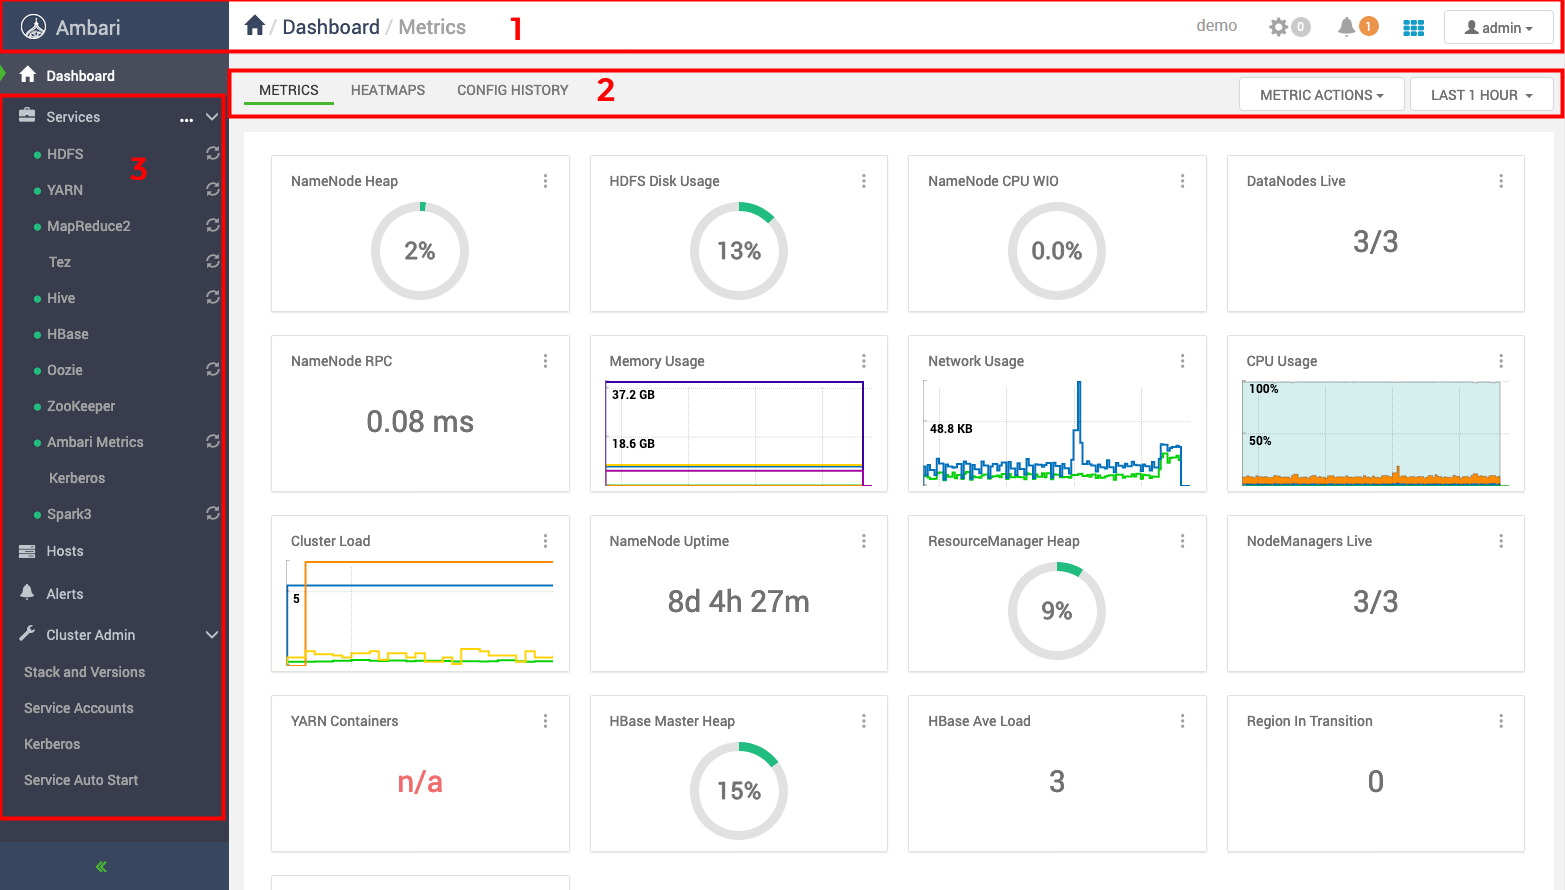
Using the top toolbar (1)
- While using Apache Ambari, select the Ambari logo, home icon, or the Dashboard link to return to the dashboard.
- View the name of your cluster on the right side of the toolbar.
- View the number of background operations running on your cluster next to the gear icon. the gear icon to view details on all the background operations. You can filter the operations based on their status. You can select each operation name to view further details about the operation, such as hosts, tasks, and task logs.
- View the number of notifications next to the bell icon. Select the bell icon to view notification details. You can filter the notifications based on whether it's a critical alert or a warning. Select View All to open the Alerts page. You can view alerts details, and manage the alerts and notifications.
- Select the grid icon to view cluster views.
- View the username you used to sign in to Apache Ambari next to the profile icon. Use the dropdown menu for more options to manage your user profile.
Using the tabs and dropdown menus (2)
- The Metrics tab is the default tab that displays when you access the dashboard. It contains various widgets that help you monitor the status of your entire cluster at a glance. You can select some widgets to view additional information. For example, Memory Usage and Network Usage. You can edit or delete a widget by using the menu icon for each widget.
You can use the Metric Actions dropdown to add or edit the widgets.
You can apply a time period to all the widgets by using the time dropdown.
- The Heatmaps tab displays cluster metrics as colored heatmaps, going from green to red. You can select the metric for which you want to view the heatmap.
- The Config History tab lists the versions of the services installed after the initial creation of the cluster.
Using the side toolbar (3)
- The Services option lists all the services installed on your cluster. You can add additional services that aren't installed by default by using the … icon. Select each service to view detailed information about that service on our cluster. The information displayed depends on the service you want to view. For example, if you select HDFS you can view Summary, Heatmaps, Configs, and Metrics tabs. Some services have useful Quick Links service specific web interfaces. Each service also has an Actions dropdown with various options depending on the service.
- The Hosts option lists details for the nodes in your cluster. You can add new hosts or manage the existing hosts using the Actions dropdown.
- The Alerts option displays a log of all the alerts, critical and warnings, received for your cluster. Use the Actions dropdown to manage alerts and notifications.
- The Cluster Admin option provides additional options for you to manage your cluster. SelectStack and Versions to view the various software or services installed on the clusters. Select Service Accounts to view users and groups for each service on your cluster. Select Kerberos to view the security configurations for your cluster. Select Service Auto Start to manage what services should be started automatically. By default, all services are configured to auto start.
Configuring Apache Ambari
Apache Ambari server settings are managed through the configuration file located at:
/etc/ambari-server/conf/ambari.properties
This file is found on the Ambari server node (for example, un0) and contains key-value pairs in the format:
property=value
Preventing Updates to Read-Only Environment Template Configurations
Big Data Service 3.1.1 and later provides a way to enforce immutability for environment template configurations (for example, *-env). Ambari can be configured to block updates by using the API.
- Add the following line to
/etc/ambari-server/conf/ambari.properties:security.server.api.validate.readonly.update=true - Restart the Ambari server to apply changes:
sudo ambari-server restart
Using Apache Ambari APIs
Use the Ambari REST APIs to integrate its capabalities into your applications.