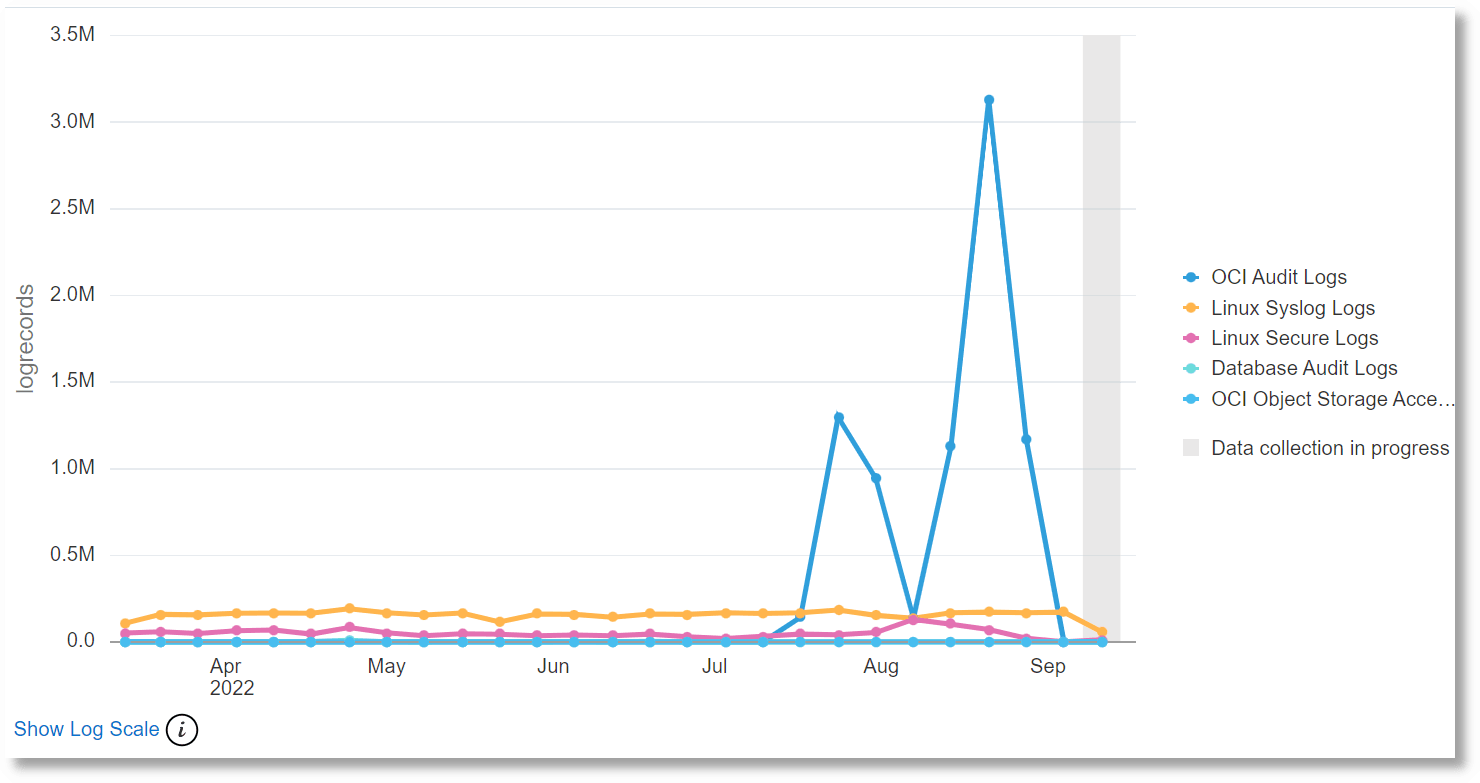
Line Charts Visualization

Oracle Logging Analytics provides a line chart visualization that lets you group by a numeric field, then graph the trend of values over time. Only numeric fields or aggregate output (sum as sum, average if the fields or output can be broken up by time) can be selected for the y-axis.
For example, to view the count of all Apache log entries, which are grouped by source, over a period in time (say the last 7 days):
  1. Open the navigation menu and click Observability & Management. Under Logging Analytics, click Log Explorer.
  2. In the Log Explorer, set the time control on the top right corner to Last Week.
  3. In the Pinned section of the Fields panel, click Log Source, select all the Apache log sources, and click Apply.
  4. In the Visualize panel, select Line (open line chart) from the visualization options.

    Line chart visualization

    • Click any time stamp along x-axis for analysis. Additionally, for selecting multiple time stamps along x-axis, click and drag to draw a rectangle around the points to drill down. Click Esc to cancel.

    • You can select multiple fields to display on the y-axis by dragging them to the Group By region. Each field is shown with a different marker shape on the line chart.
    • Enable Show problem logs only check box to view only those log records plotted on the chart which have non-null values for the field Problem Priority.
    • Enable Show log scale check box when the log record count range is wide so that logarithmic scale is applied on the values to view them all on the chart.
    • Click Settings Edit icon button:
      • Select the Chart type from Line with marker, Line without marker, Line with area, or Marker only, based on your requirement.
      • Select Line type straight or Curved.
      • Select Line width Normal or Thin.
      • For the Tooltip hover behavior, select Hover anywhere over chart or Hover directly over marker. Hover anywhere over chart connects to the nearest point and markers are not required. Hover directly over marker works best with markers shown.
      • For the Tooltip type, show Show single series or Show all series. When you select Show all series, the values of all series in the specified time range are displayed when you hover the cursor over a specific marker.
The count of Apache log records grouped by Log Source is displayed in the chart.