Pie Chart Example
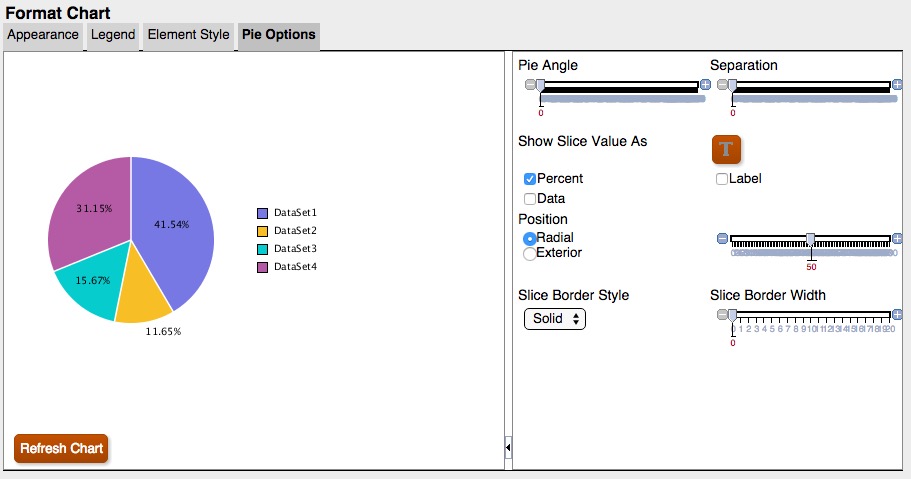
In this example, "Show Slice Value As" is set to "Percent", which shows a percentage data point for each slice of the pie.
Figure 5-10 Pie Options Tab in the Updated Charting Engine

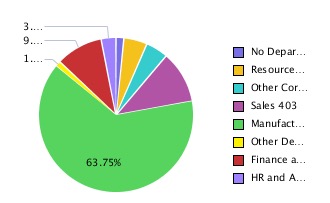
The data points are cut off or not visible for some slices. In addition, the legend text is cut off.
Figure 5-11 Pie Chart with Legend Data Points Cut Off

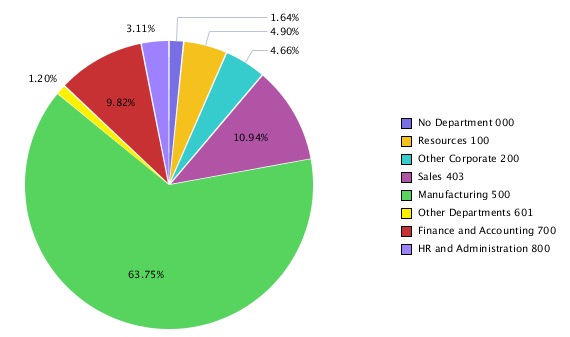
By increasing the size of the chart on the report canvas, the entire legend and all data points are displayed.
Figure 5-12 Pie Chart Displaying the Legend and All the Data Points
