Viewing Insights in Smart View
You can view the list of available insights in the IPM Insights dialog, along with their details.
To view IPM Insights in Oracle Smart View for Office:
- Open a Microsoft Excel sheet, a Microsoft Word document, or a Microsoft PowerPoint slide and connect to your business process that has IPM Insights.
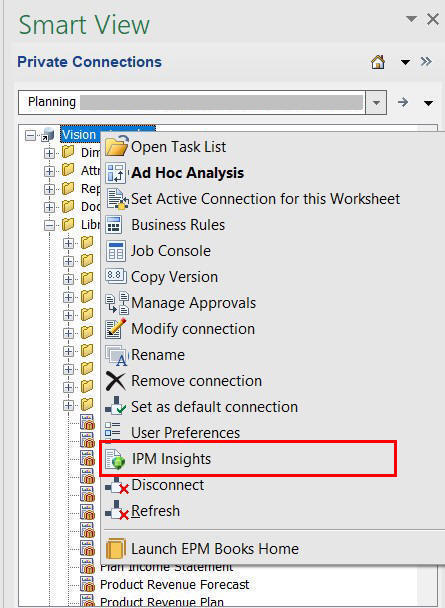
- In the Smart View Panel, right-click the application
name and then click IPM Insights.

Alternatively, you can also click More in the Action panel and then click IPM Insights. The IPM Insights dialog displays all the available insights generated in the application.
- View the list of available insights generated for the application in the
IPM Insights dialog, along with the following details:
- Impact: Indicates the relative amount of deviation or impact from the usual value in percentage.
- Values: Displays the absolute value of the deviation for an insight.
- Details: Describes the insight statement in brief.
- POV: Indicates the POV values involved in the insight.
- Type: Indicates the type of insight — Anomaly, Prediction, or Forecast Variance and Bias.
- Priority: Indicates the category of insight — High, Medium, or Low priority.
- Status: Indicates the status of insight — Open or Closed.

In Word and PowerPoint, you can select an insight by clicking a row. In Excel, you can select multiple insights by selecting the respective check boxes.
- Optional: You can filter the list of available insights based on insight
type, POV, priority, and status to find a specific insight faster. In the filter box
on top of the insights list, start typing "Type:", "POV:", or
"Priority:" and you will see the filter parameters matching your searched
term. Select the required parameter to view a filtered list of insights matching the
parameter.
For example, to filter on an insight type, start typing "Type:" and select the required parameter from the list. In the following example, "Type: Anomaly" is selected.

The insights list is filtered to display only anomaly type of insights. You can further filter this list, say as per priority, by typing "Priority:" and selecting the High parameter.

The list now displays anomaly type of insights with high priority.

You can apply up to 5 filters at a time to see a list of insights matching different combinations of the applied filters. For example, if you apply the Type filter for Anomaly and Prediction values, and the Priority filter for High and Medium values, the filtered list displays insights for the following combinations:
- Anomaly and High
- Anomaly and Medium
- Prediction and High
- Prediction and Medium
To remove an applied filter, click the Close icon on the filter.
- Proceed with inserting insights, inserting functions, or analyzing insights data in ad hoc grids. For more information, see the following topics: