Viewing All Metrics for JD Edwards EnterpriseOne Application Interface Services Server
Use this procedure to view all metrics for the JD Edwards EnterpriseOne Application Interface Services Server.
On Members for JDE EnterpriseOne Domain, click the link for the Name for the EnterpriseOne Application Interface Services Server.
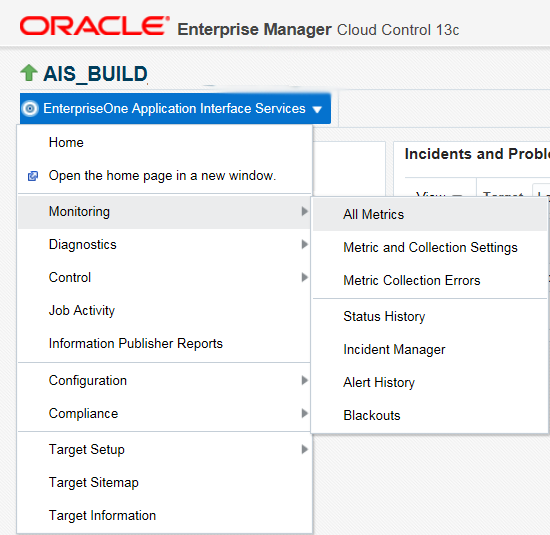
With the JDE EnterpriseOne target displayed in Cloud Control, navigate to EnterpriseOne Application Interface Services Server, Monitoring, All Metrics.
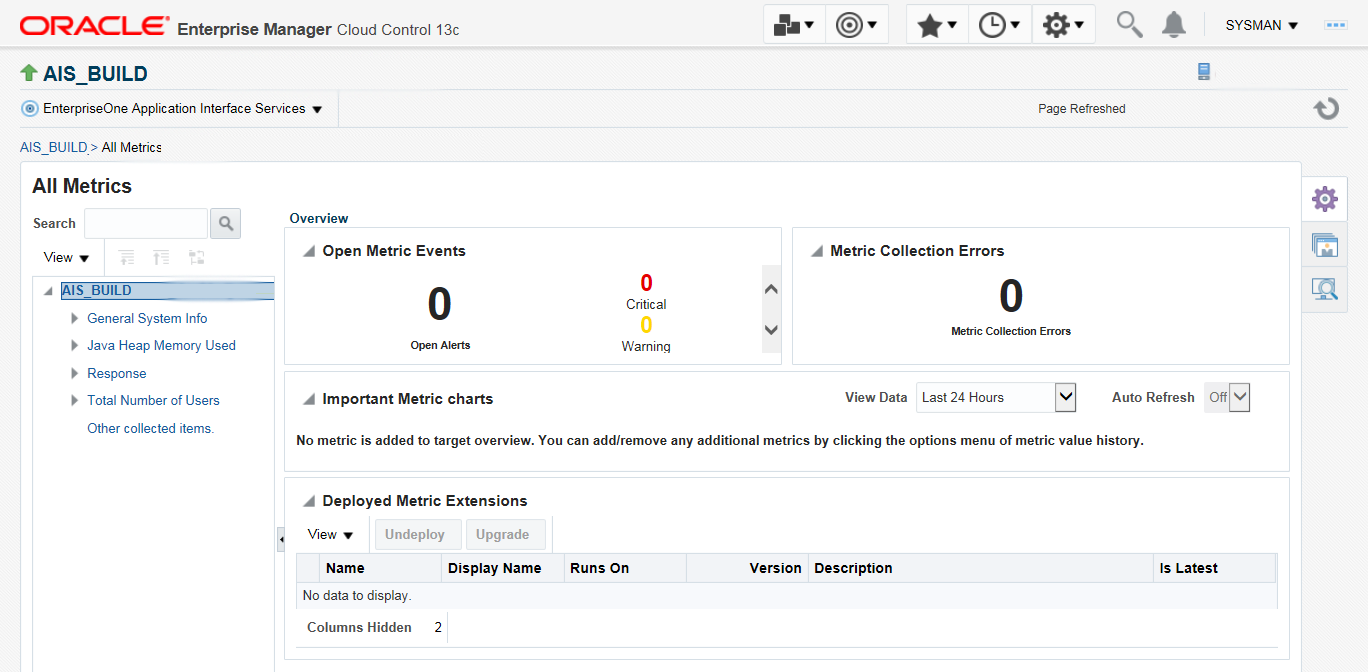
On the All Metrics form, you can view any of the metrics that are available for the JD Edwards EnterpriseOne Application Interface Services Server. These metrics include:
General System Info
Java Heap Memory Used
Response
Total Number of Users
Other collected items
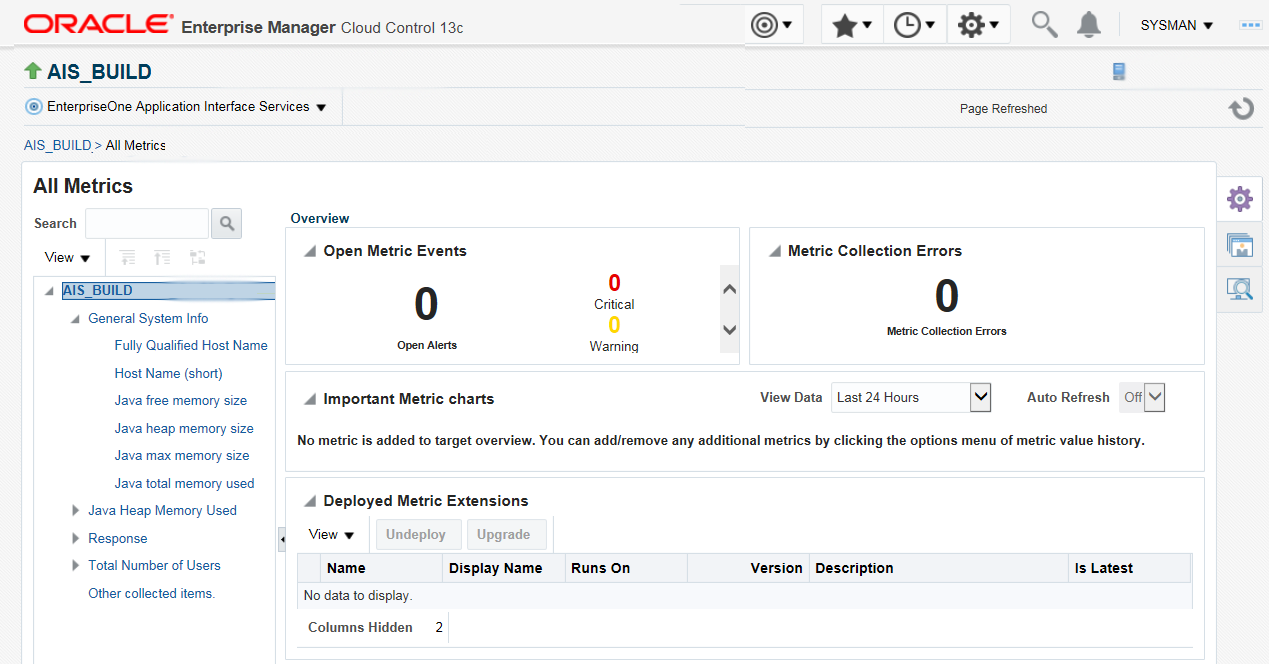
You can expand a metric node to view its subnodes. The following screen is an example of the metrics when you click the General System Info node.
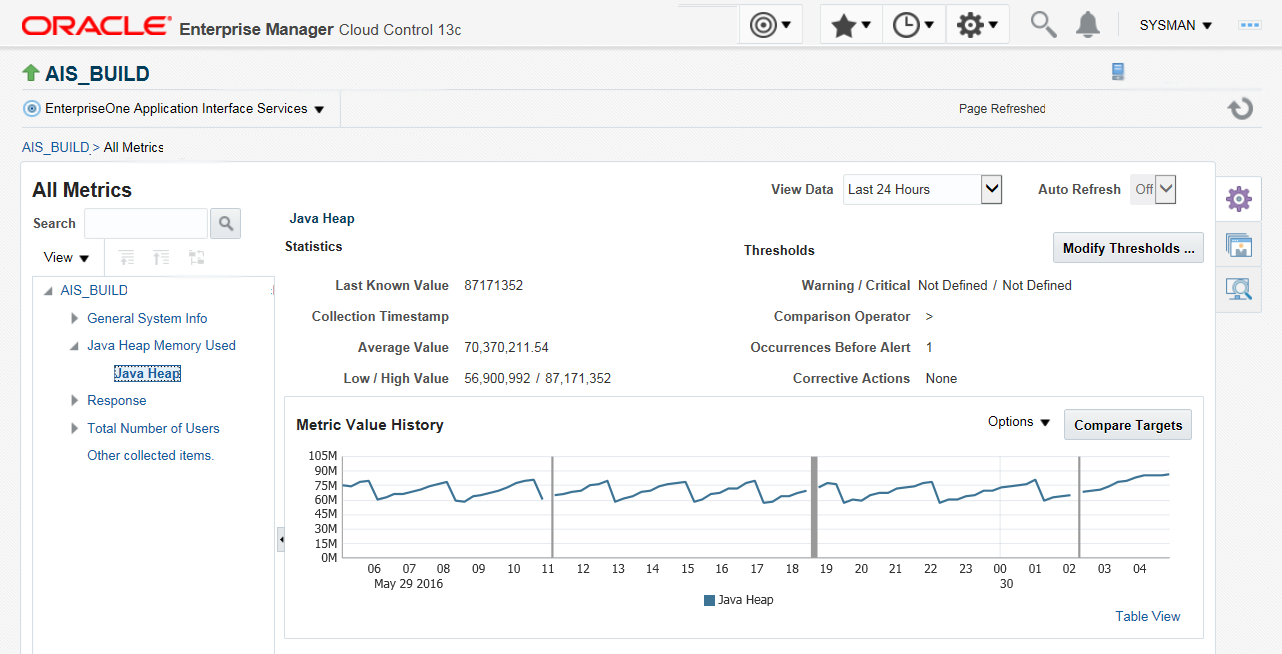
You can also click the subnodes to display additional information. The following screen is an example of the metrics shown when you click the Java Heap of the Java Heap Memory Used node.