Viewing All Metrics for JD Edwards EnterpriseOne Enterprise Server
Use this procedure to view all metrics for the JD Edwards EnterpriseOne Enterprise Server.
On Members for JDE EnterpriseOne Domain (or also from the Dashboard for the JDE EnterpriseOne Domain), click the link for the Name of the EnterpriseOne Enterprise Server.
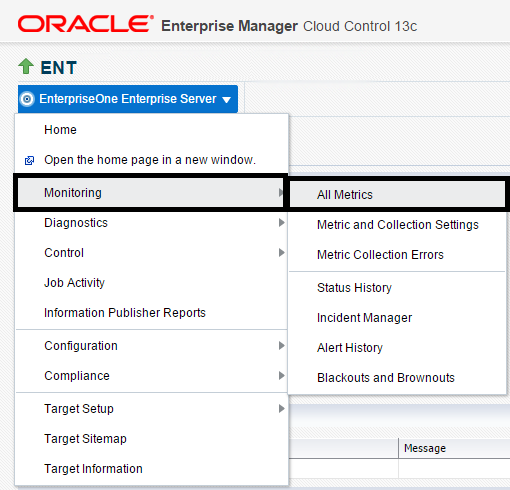
With the JDE EnterpriseOne target displayed in Cloud Control, navigate to EnterpriseOne Enterprise Server, Monitoring, All Metrics.

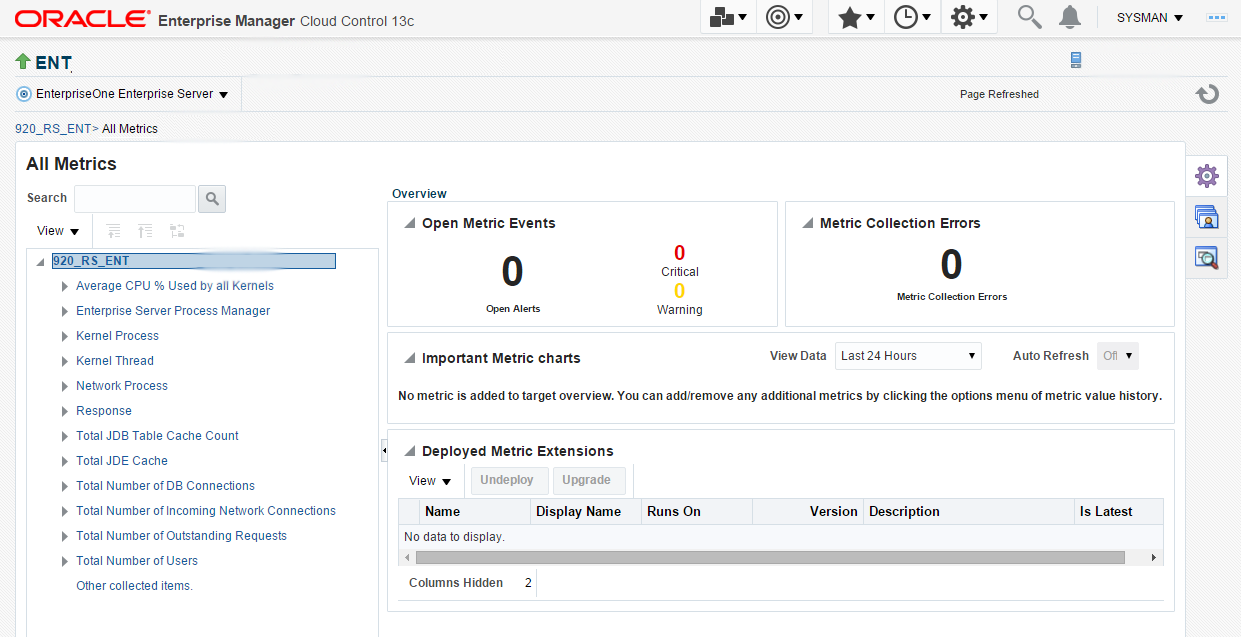
On the All Metrics form, you can view any of the metrics that are available for the JD Edwards EnterpriseOne Enterprise Server. These metrics include:
Average CPU % Used by All Kernels
Enterprise Server Process Manager
JDE Enterprise Server Log Monitor (Release 9.2.1 Update)
Kernel Process
Kernel Thread
Network Process
Response
Total JDB Table Cache Count
Total JDE Cache
Total Number of DB Connections
Total Number of Incoming Network Connections
Total Number of Outstanding Requests
Total Number of Users
Other collected items

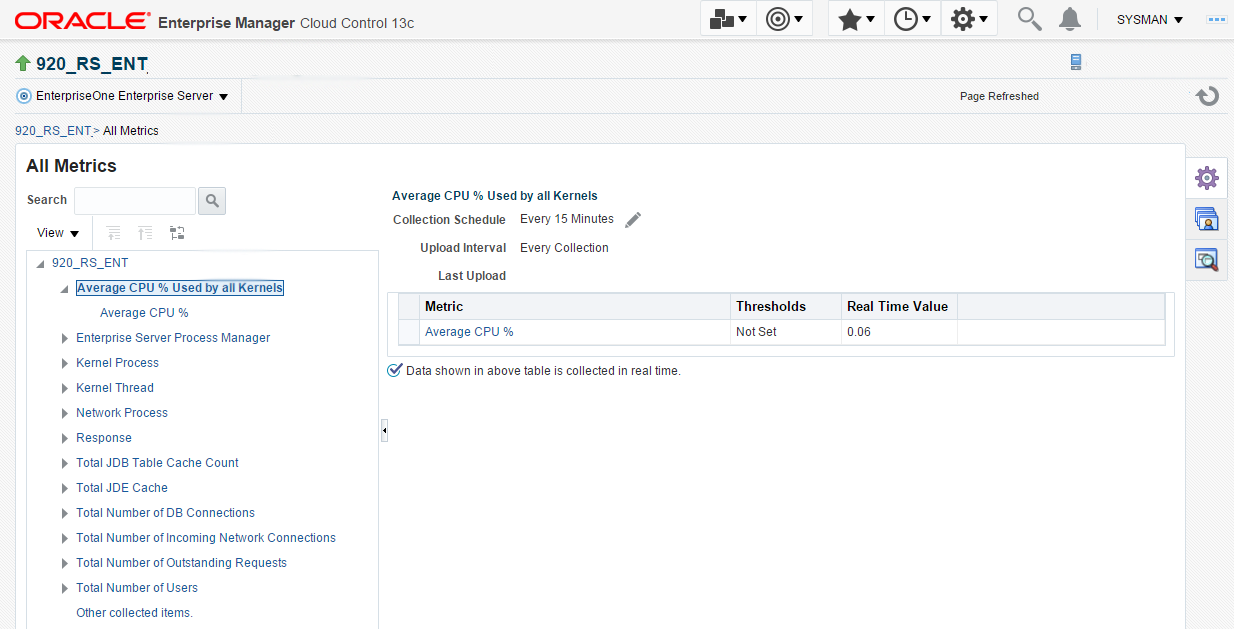
You can expand a metric node to view its subnodes. The following screen is an example of the metrics when you click the Average CPU % Used By All Kernels node.

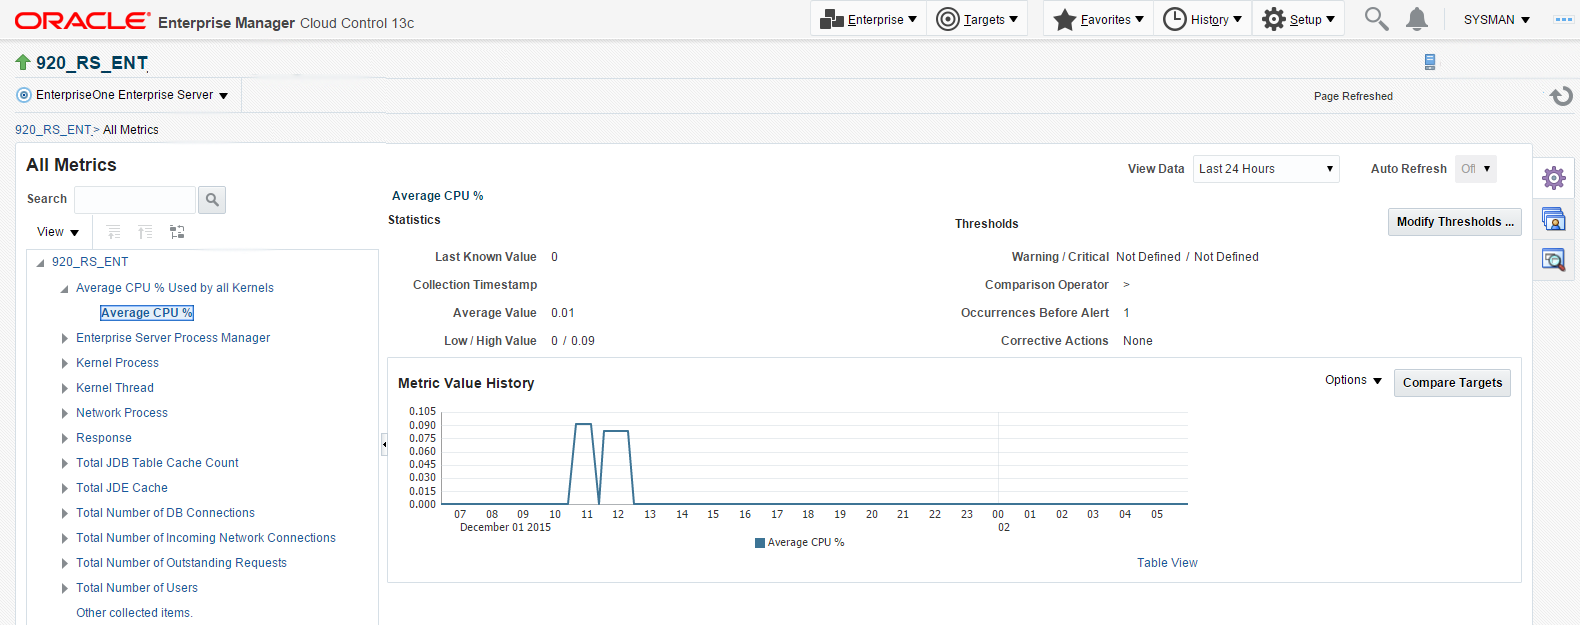
You can also click the subnodes to display additional information. The following screen is a sample of the metrics shown when you click the Average CPU % subnode of the Average CPU % Used By All Kernels node.
